New High vs. New Low Index Indicator for ThinkorSwim

markos

Well-known member
VIP
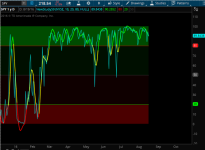
A leading indicator that compares stocks hitting new highs and new lows within the stock market. The Chart below is of the Market Meltdown in January, 2016. It's hard to be Bearish on the Market as a whole when new highs are breaking out!

jBKewag.png


Code:
#This indicator uses the Index New highs and Index New lows
#to help gauge overall Market sentiment. It's a leading indicator. 
# Index New High - New Low Indicator
# Mobius v2018-March from JQ's OneNote
#After loading, pull it to the upper chart!

declare lower;
input Symb = {default "NYSE", "NASDQ", "AMEX", "ARCA", "ETF"};
input length = 10;
input OverSold = 20;
input OverBought = 80;
Input AvgType = AverageType.Hull;

def agg = AggregationPeriod.Day;
def NYSEH  = close(Symbol = "$NYHGH", period = agg);
def NYSEL  = close(Symbol = "$NYLOW", period = agg);
def NASDQH = close(Symbol = "$NAHGH", period = agg);
def NASDQL = close(Symbol = "$NALOW", period = agg);
def AMEXH  = close(Symbol = "$AMHGH", period = agg);
def AMEXL  = close(Symbol = "$AMLOW", period = agg);
def ARCAH  = close(Symbol = "$ARHGH", period = agg);
def ARCAL  = close(Symbol = "$ARLOW", period = agg);
def ETFH   = close(Symbol = "$ETFHGH", period = agg);
def ETFL   = close(Symbol = "$ETFLOW", period = agg);
def P;
Switch (Symb){
case "NYSE":
P = NYSEH / (NYSEH + NYSEL) * 100;
case "NASDQ":
P = NASDQH / (NASDQH + NASDQL) * 100;
case "AMEX":
P = AMEXH / (AMEXH + AMEXL) * 100;
case "ARCA":
P = ARCAH / (ARCAH + ARCAL) * 100;
case "ETF":
P = ETFH / (ETFH + ETFL) * 100;
}
def price = if isNaN(P) then price[1] else P;
plot data = if isNaN(close) then double.nan else price;
data.EnableApproximation();
data.SetDefaultColor(Color.Cyan);
plot avg = MovingAverage(AvgType, data, length);
avg.EnableApproximation();
avg.AssignValueColor(if between(avg, OverSold, OverBought)
                     then Color.yellow
                     else if avg >= OverBought
                          then Color.Green
                          else Color.Red);
avg.SetLineWeight(2);

plot OB = if isNaN(close) then double.nan else OverBought;
OB.SetDefaultColor(Color.Red);

plot OS = if isNaN(close) then double.nan else OverSold;
OS.SetDefaultColor(Color.Green);

plot neutral = if isNaN(close) then double.nan else 50;
neutral.SetdefaultColor(Color.Dark_Gray);

addCloud(0, OS, CreateColor(250,0,0), CreateColor(250,0,0));
addCloud(OS, neutral, createColor(50,0,0), createColor(50,0,0));
addCloud(neutral, OB, createColor(0,50,0), createColor(0,50,0));
addCloud(OB, 100, CreateColor(0,250,0), createColor(0,250,0));

# End High - Low Index

Shared link https://tos.mx/VhAvab
 

Attachments

  • jBKewag.png
    jBKewag.png
    90.6 KB · Views: 322
Last edited by a moderator:

Join useThinkScript to post your question to a community of 21,000+ developers and traders.

Is there a way to make a scanner that shows how many times a stock has made a new high on the day? Sure would be nice to look 30 min in and see a stock has made 20 new highs
 
New High New Low Indicator

Code:
declare upper;

input length      = 252;

def highestHigh   = fold highIdx = 1 to length with sHigh = high do if sHigh > GetValue( high, highIdx, length + 1 ) then sHigh else GetValue( high, highIdx, length + 1 );
plot NewHigh      = if highestHigh > highestHigh[1] then high else Double.NaN;

def lowestLow     = fold lowIdx = 1 to length with sLow = low do if sLow < GetValue( low, lowIdx, length + 1 ) then sLow else GetValue( low, lowIdx, length + 1 );
plot NewLow       = if lowestLow < lowestLow[1] then low else Double.NaN;

#===============================[ Look & Feel ]================================
NewHigh.SetPaintingStrategy( PaintingStrategy.ARROW_DOWN );
NewHigh.SetDefaultColor( Color.PLUM );
NewHigh.SetLineWeight( 3 );
NewLow.SetPaintingStrategy( PaintingStrategy.ARROW_UP );
NewLow.SetDefaultColor( Color.BLUE );
NewLow.SetLineWeight( 3 );
 
A leading indicator that compares stocks hitting new highs and new lows within the stock market. The Chart below is of the Market Meltdown in January, 2016. It's hard to be Bearish on the Market as a whole when new highs are breaking out!

jBKewag.png


Code:
#This indicator uses the Index New highs and Index New lows
#to help gauge overall Market sentiment. It's a leading indicator. 
# Index New High - New Low Indicator
# Mobius v2018-March from JQ's OneNote
#After loading, pull it to the upper chart!

declare lower;
input Symb = {default "NYSE", "NASDQ", "AMEX", "ARCA", "ETF"};
input length = 10;
input OverSold = 20;
input OverBought = 80;
Input AvgType = AverageType.Hull;

def agg = AggregationPeriod.Day;
def NYSEH  = close(Symbol = "$NYHGH", period = agg);
def NYSEL  = close(Symbol = "$NYLOW", period = agg);
def NASDQH = close(Symbol = "$NAHGH", period = agg);
def NASDQL = close(Symbol = "$NALOW", period = agg);
def AMEXH  = close(Symbol = "$AMHGH", period = agg);
def AMEXL  = close(Symbol = "$AMLOW", period = agg);
def ARCAH  = close(Symbol = "$ARHGH", period = agg);
def ARCAL  = close(Symbol = "$ARLOW", period = agg);
def ETFH   = close(Symbol = "$ETFHGH", period = agg);
def ETFL   = close(Symbol = "$ETFLOW", period = agg);
def P;
Switch (Symb){
case "NYSE":
P = NYSEH / (NYSEH + NYSEL) * 100;
case "NASDQ":
P = NASDQH / (NASDQH + NASDQL) * 100;
case "AMEX":
P = AMEXH / (AMEXH + AMEXL) * 100;
case "ARCA":
P = ARCAH / (ARCAH + ARCAL) * 100;
case "ETF":
P = ETFH / (ETFH + ETFL) * 100;
}
def price = if isNaN(P) then price[1] else P;
plot data = if isNaN(close) then double.nan else price;
data.EnableApproximation();
data.SetDefaultColor(Color.Cyan);
plot avg = MovingAverage(AvgType, data, length);
avg.EnableApproximation();
avg.AssignValueColor(if between(avg, OverSold, OverBought)
                     then Color.yellow
                     else if avg >= OverBought
                          then Color.Green
                          else Color.Red);
avg.SetLineWeight(2);

plot OB = if isNaN(close) then double.nan else OverBought;
OB.SetDefaultColor(Color.Red);

plot OS = if isNaN(close) then double.nan else OverSold;
OS.SetDefaultColor(Color.Green);

plot neutral = if isNaN(close) then double.nan else 50;
neutral.SetdefaultColor(Color.Dark_Gray);

addCloud(0, OS, CreateColor(250,0,0), CreateColor(250,0,0));
addCloud(OS, neutral, createColor(50,0,0), createColor(50,0,0));
addCloud(neutral, OB, createColor(0,50,0), createColor(0,50,0));
addCloud(OB, 100, CreateColor(0,250,0), createColor(0,250,0));

# End High - Low Index

Shared link https://tos.mx/VhAvab
Could I add Russell2000 if so what would be the Rut input ?
 
Could I add Russell2000 if so what would be the Rut input ?
Same question I have here. I love the indicator I have been using it for swing trades and to get a feel for market sentiment for the last couple months. Kept me out of this pull back using the Nasdaq as the input.
 

Not the exact question you're looking for?

Start a new thread and receive assistance from our community.

87k+ Posts
386 Online
Create Post

The Market Trading Game Changer

Join 2,500+ subscribers inside the useThinkScript VIP Membership Club
  • Exclusive indicators
  • Proven strategies & setups
  • Private Discord community
  • ‘Buy The Dip’ signal alerts
  • Exclusive members-only content
  • Add-ons and resources
  • 1 full year of unlimited support

Frequently Asked Questions

What is useThinkScript?

useThinkScript is the #1 community of stock market investors using indicators and other tools to power their trading strategies. Traders of all skill levels use our forums to learn about scripting and indicators, help each other, and discover new ways to gain an edge in the markets.

How do I get started?

We get it. Our forum can be intimidating, if not overwhelming. With thousands of topics, tens of thousands of posts, our community has created an incredibly deep knowledge base for stock traders. No one can ever exhaust every resource provided on our site.

If you are new, or just looking for guidance, here are some helpful links to get you started.

What are the benefits of VIP Membership?
VIP members get exclusive access to these proven and tested premium indicators: Buy the Dip, Advanced Market Moves 2.0, Take Profit, and Volatility Trading Range. In addition, VIP members get access to over 50 VIP-only custom indicators, add-ons, and strategies, private VIP-only forums, private Discord channel to discuss trades and strategies in real-time, customer support, trade alerts, and much more. Learn all about VIP membership here.
How can I access the premium indicators?
To access the premium indicators, which are plug and play ready, sign up for VIP membership here.
Back
Top