Multiple Time Frame (MTF) Squeeze Indicator for ThinkorSwim

laketrader

Member
2019 Donor
VIP
Hi all

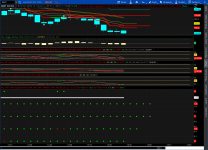
To give back a little to the community, I developed a MTF squeeze indicator for ThinkOrSwim as an alternative to the overpriced internet version . TTM squeeze code is not available on TOS but luckily Mobius provided a replication of TTM squeeze on onedrive.

The base scrip is as follows:

thinkScript Code

Code:
# the script develped by laketrader trying to replicate multitimeframe squeeze

# indicator as an alternative to the overpriced internet version.

# TTM squeeze code is not available on TOS  but luckily Mobius provided a excellent

# replication of TTM squeeze on onedrive. Thus, the squeeze logic was based on Mobius's

# code.

#

# changing the first line dStr to diffeent timeframe will switch to different timeframe.

# e.g.

# dStr = "Weekly" wil change to weekly squeeze

input dStr ="Day";

script MySqueeze{

def length  = 20;

def AtrMult = 1.5;

def SdMult  = 2.0;

input period ="Daily";

def valueClose   =  close(period = period);

def valueHigh   =  high(period = period);

def valueLow   =  low(period = period);

def SD = StDev(valueClose, length);

def Avg = Average(valueClose, length);

def ATR = Average(TrueRange(valueHigh, valueClose, valueLow), length);

def SDup = Avg + (SdMult * SD);

def ATRup = Avg + (AtrMult * ATR);

plot Squeeze = if SDup < ATRup

               then 1

               else 0;

}

def dSQ= MySqueeze(dStr);

AddLabel(yes, dStr, if dSQ

then  Color.RED else  Color.GREEN); # display label red if has squeeze

TOS shareable link:

https://tos.mx/1L08qy
 
I modified your script to make it a bit easier to select a time frame and how it is displayed. It still requires to add several to see which time frame is in a squeeze.

Code:
changed line :  input dStr ="Day";    to
        input dStr =aggregationPeriod.DAY;


changed line :  input period ="Daily";   to
        input period =aggregationPeriod.DAY;

changed lines:    AddLabel(yes, dStr,   to

    AddLabel(yes, if dStr == aggregationPeriod.MONTH then "M"
    else
    if dStr == aggregationPeriod.WEEK then "W"
    else
    if dStr == aggregationPeriod.FOUR_DAYS then "4D"
    else
    if dStr == aggregationPeriod.THREE_DAYS then "3D"
    else
    if dStr == aggregationPeriod.TWO_DAYS then "2D"
    else
    if dStr == aggregationPeriod.DAY then "D"
    else
    if dStr == aggregationPeriod.FOUR_HOURS then "4H"
    else
    if dStr == aggregationPeriod.TWO_HOURS then "2H"
    else
    if dStr == aggregationPeriod.HOUR then "60m"
    else
    if dStr == aggregationPeriod.THIRTY_MIN then "30m"
    else
    if dStr == aggregationPeriod.TWENTY_MIN then "20m"
    else
    if dStr == aggregationPeriod.FIFTEEN_MIN then "15m"
    else
    if dStr == aggregationPeriod.TEN_MIN then "10m"
    else
    if dStr == aggregationPeriod.FIVE_MIN then "5m"
    else
    if dStr == aggregationPeriod.FOUR_MIN then "4m"
    else
    if dStr  == aggregationPeriod.THREE_MIN then "3m"
    else
    if dStr == aggregationPeriod.TWO_MIN then "2m"
    else
    if dStr  == aggregationPeriod.MIN then "1m"
    else "",

This way you just click on the desired time frame.

GZbLWfW.png
 
I don't believe it is possible. The time frames are predefined. Should be possible with getAggregationPeriod() but it is limited does not return required value.
 
Great. It is a good modification. I am still trying to see if we can do some custom timeframe like 195 min, 130 min etc. Have not figured it out yet.
@laketrader @noobstocktrader101 I believe that the Fractal used by many to divide a day is 78 Minutes.
Which is 5x smaller than Day, then Week is 5x larger than Day. Don't over think it.
If too many time frames are checked, it can lead to analysis paralysis.

It is not the indicator that should change. Only the chart agg. 20 periods is 20 periods, no matter the time frame.
 
Last edited:
I don't believe it is possible. The time frames are predefined. Should be possible with getAggregationPeriod() but it is limited does not return required value.
@noobstocktrader101 Help yourself get balance. Trade using Paper Money for 1 Month and record everything you do incl. why you "Bot" or Sold.
General rules of thumb, NOT trading advice:
  • Always keep individual trades to 1% of potential loss, trade small and live to trade another day. This is simple but not easy.
  • Stick to a few stocks & indicators you know well and watch / write down if they fit the time you bot/sold.
  • Do you cut your losses & let winners run?
Why are you working with TTM Squeeze? What other indicators have you tried? Tell us, so it's easier to possibly help you. Thanks!
 
Last edited:
TTM is the name of the Person or Group that created the Study. As in, Bollinger Bands were created by Mr. Bollinger.
 
I believe TTM stands for "Trade The Markets" which was a collaborative venture between John Carter and Hubert Senters.

By the way, John Carter has updated the Squeeze with the Squeeze Pro after 10+ years. The updated indicator supposedly catches a lot of breakouts that the original Squeeze indicator misses.
 
@lucassow @laketrader MultiTime Frame TTM Squeeze. Here you go.
nOXc4Z8.png

Code:
###CollegeTrader

###CT_MTF_TTM_Squeeze_Replica

###

###Original TTM_Squeeze_Replica Code from Mobius

#hint:Helps identify periods of low volatility on multiple timeframes


Declare lower;

### Time Aggregations ############


input time1 = AggregationPeriod.five_min; #hint time1:  Plot @ 0.

input time2 = AggregationPeriod.ten_min; #hint time2:  Plot @ 0.5.

input time3 = AggregationPeriod.twenty_min; #hint time3:  Plot @ 1.

input time4 = AggregationPeriod.hour; #hint time4:  Plot @ 1.5.


### Master Plot On/Off ###########

input Master_Squeeze_Plot = Yes; #hint Master_Squeeze_Plot:  Turns the master squeeze plot on or off.


### Time1 Squeeze Code ##############


input length  = 20;

input AtrMult = 1.5;

input SdMult  = 2.0;


def SD = StDev(close(period = time1), length);

def Avg = Average(close(period = time1), length);

def ATR = Average(TrueRange(high(period = time1), close(period = time1), low(period = time1)), length);

def SDup = Avg + (SdMult * Sd);

def ATRup = Avg + (AtrMult * ATR);


plot Squeeze = if SDup < ATRup 

then 0 

else Double.NaN;

Squeeze.SetPaintingStrategy(PaintingStrategy.Points);

Squeeze.SetLineWeight(4);

Squeeze.SetDefaultColor(Color.Red);


plot zero = if IsNaN(close(period = time1)) or !IsNaN(Squeeze) then Double.NaN else 0;

zero.SetPaintingStrategy(PaintingStrategy.Points);

zero.SetLineWeight(4);

zero.SetDefaultColor(Color.Green);


### time2 Code #####################


def SD2 = StDev(close(period = time2), length);

def Avg2 = Average(close(period = time2), length);

def ATR2 = Average(TrueRange(high(period = time2), close(period = time2), low(period = time2)), length);

def SDup2 = Avg2 + (SdMult * Sd2);

def ATRup2 = Avg2 + (AtrMult * ATR2);


plot Squeeze2 = if SDup2 < ATRup2 

then 0.5 

else Double.NaN;

Squeeze2.SetPaintingStrategy(PaintingStrategy.Points);

Squeeze2.SetLineWeight(4);

Squeeze2.SetDefaultColor(Color.Red);


plot zero2 = if IsNaN(close(period = time2)) or !IsNaN(Squeeze2) then Double.NaN else 0.5;

zero2.SetPaintingStrategy(PaintingStrategy.Points);

zero2.SetLineWeight(4);

zero2.SetDefaultColor(Color.Green);


### time3 Code ####################


def SD3 = StDev(close(period = time3), length);

def Avg3 = Average(close(period = time3), length);

def ATR3 = Average(TrueRange(high(period = time3), close(period = time3), low(period = time3)), length);

def SDup3 = Avg3 + (SdMult * Sd3);

def ATRup3 = Avg3 + (AtrMult * ATR3);


plot Squeeze3 = if SDup3 < ATRup3 

then 1 

else Double.NaN;

Squeeze3.SetPaintingStrategy(PaintingStrategy.Points);

Squeeze3.SetLineWeight(4);

Squeeze3.SetDefaultColor(Color.Red);


plot zero3 = if IsNaN(close(period = time3)) or !IsNaN(Squeeze3) then Double.NaN else 1;

zero3.SetPaintingStrategy(PaintingStrategy.Points);

zero3.SetLineWeight(4);

zero3.SetDefaultColor(Color.Green);


### time4 Code ########################


def SD4 = StDev(close(period = time4), length);

def Avg4 = Average(close(period = time4), length);

def ATR4 = Average(TrueRange(high(period = time4), close(period = time4), low(period = time4)), length);

def SDup4 = Avg4 + (SdMult * Sd4);

def ATRup4 = Avg4 + (AtrMult * ATR4);


plot Squeeze4 = if SDup4 < ATRup4 

then 1.5 

else Double.NaN;

Squeeze4.SetPaintingStrategy(PaintingStrategy.Points);

Squeeze4.SetLineWeight(4);

Squeeze4.SetDefaultColor(Color.Red);


plot zero4 = if IsNaN(close(period = time4)) or !IsNaN(Squeeze4) then Double.NaN else 1.5;

zero4.SetPaintingStrategy(PaintingStrategy.Points);

zero4.SetLineWeight(4);

zero4.SetDefaultColor(Color.Green);


### Master Squeeze Signal ################


plot line = if !IsNaN(close) and Master_Squeeze_Plot == Yes then 1.75 else Double.Nan;

line.SetPaintingStrategy(PaintingStrategy.Line);

line.SetLineWeight(5);

line.setdefaultcolor(color.white);


plot Master_Squeeze = if Master_Squeeze_Plot == Yes and ((SDup < ATRup) and (SDup2 < ATRup2) and (SDup3 < ATRup3) and (SDup4 < ATRup4))


then 2

else Double.NaN;

Master_Squeeze.SetPaintingStrategy(PaintingStrategy.Points);

Master_Squeeze.SetLineWeight(4);

Master_Squeeze.SetDefaultColor(Color.Red);


plot Master_Zero = if IsNaN(close) or !(SDup < ATRup) and !(SDup2 < ATRup2) and !(SDup3 < ATRup3) and !(SDup4 < ATRup4)

then Double.NaN

else if (Master_Squeeze_Plot == Yes) then 2

else Double.NaN;

Master_Zero.SetPaintingStrategy(PaintingStrategy.Points);

Master_Zero.SetLineWeight(4);

Master_Zero.SetDefaultColor(Color.Green);
 

Attachments

  • nOXc4Z8.png
    nOXc4Z8.png
    129.9 KB · Views: 280
Last edited by a moderator:
@lucassow No. Never have used it. But read the code.

input time1 = AggregationPeriod.five_min; #hint time1: Plot @ 0.

input time2 = AggregationPeriod.ten_min; #hint time2: Plot @ 0.5.

input time3 = AggregationPeriod.twenty_min; #hint time3: Plot @ 1.

input time4 = AggregationPeriod.hour; #hint time4: Plot @ 1.5.

So 5 min squeeze is plotted at 0
10 Min plotted a 0.5 and so on
That gives you the agg periods

A red dot is a squeeze at that time agg. The more red dots at more aggs and bigger the squeeze.
 
Hey @BenTen and @markos - How do you guys prefer to use this indicator?, I read through the link @BenTen posted, not sure how exactly the indicator is working but it does explain what the author plans to do based on the dots and color changes.
 
Hey @BenTen and @markos - How do you guys prefer to use this indicator?, I read through the link @BenTen posted, not sure how exactly the indicator is working but it does explain what the author plans to do based on the dots and color changes.
@ganq I don't use it but know that many do. To each their own. A squeeze happens when the Keltner Channels are inside the bounds of the Bollinger Bands. Keltner's are based on ATR and Bollinger's are based on Standard Deviation. They are both classified as Volatility Indicators. The explanation of these things should be looked for on the TDA website as well as school.stockcharts.com.
 
@ganq I don't use it but know that many do. To each their own. A squeeze happens when the Keltner Channels are inside the bounds of the Bollinger Bands. Keltner's are based on ATR and Bollinger's are based on Standard Deviation. They are both classified as Volatility Indicators. The explanation of these things should be look for on the TDA website as well as school.stockcharts.com.
Got it thanks!

Which Moving Averages are we using here for Keltner and BBs?
 
Check the code, it should be listed near the top as an Input.
Default for Bollinger Bands is usually 20 SMA and I believe Keltner's adjust off of ATR, don't know about MA's. (I could Be wrong, wife often reminds me that I am!)
In the Tutorial I have a short write up on Bollinger Bands please take a look.
 
Last edited:
Not sure about the blank spots but this is my version of the squeeze with MORE DOTS!
There are 6 aggregations, you can pick the "vote" for the topline to show is "x" of 6 are in line with each other.
GnPPmSd.png

Code:
declare lower;
input AP1 = AggregationPeriod.DAY;
input AP2 = AggregationPeriod.TWO_DAYS;
input AP3 = AggregationPeriod.THREE_DAYS;
input AP4 = AggregationPeriod.FOUR_DAYS;
input AP5 = AggregationPeriod.WEEK;
input AP6 = AggregationPeriod.MONTH;
input vote = 3;

def price1 = CLOSE(period = AP1);
def price2 = CLOSE(period = AP2);
def price3 = CLOSE(period = AP3);
def price4 = CLOSE(period = AP4);
def price5 = CLOSE(period = AP5);
def price6 = CLOSE(period = AP6);
def length = 20;
def nK = 1.5;
def nBB = 2.0;
def alertLine = 1.0;
def Sqz_Length = 3;

def squeezeDots1 = TTM_Squeeze(price1, length, nK, nBB, alertLine).SqueezeAlert;
def squeezeDots2 = TTM_Squeeze(price2, length, nK, nBB, alertLine).SqueezeAlert;
def squeezeDots3 = TTM_Squeeze(price3, length, nK, nBB, alertLine).SqueezeAlert;
def squeezeDots4 = TTM_Squeeze(price4, length, nK, nBB, alertLine).SqueezeAlert;
def squeezeDots5 = TTM_Squeeze(price5, length, nK, nBB, alertLine).SqueezeAlert;
def squeezeDots6 = TTM_Squeeze(price6, length, nK, nBB, alertLine).SqueezeAlert;


def Top_Plot = (squeezeDots1 + squeezeDots2 + squeezeDots3 + squeezeDots4 +  squeezeDots5 +squeezeDots6) >= Vote;

plot MTF_Sqz = 7;
MTF_Sqz.SetPaintingStrategy(PaintingStrategy.POINTS);
MTF_Sqz.AssignValueColor(if Top_Plot == 1 then Color.BLACK else Color.DARK_RED);
MTF_Sqz.SetLineWeight(5);

plot Sqeezy1 = if squeezeDots1 == 1 then squeezeDots1 + 5 else 6;
plot Sqeezy2 = if squeezeDots2 == 1 then squeezeDots2 + 4 else 5;
plot Sqeezy3 = if squeezeDots3 == 1 then squeezeDots3 + 3 else 4;
plot Sqeezy4 = if squeezeDots4 == 1 then squeezeDots4 + 2 else 3;
plot Sqeezy5 = if squeezeDots5 == 1 then squeezeDots5 + 1 else 2;
plot Sqeezy6 = if squeezeDots6 == 1 then squeezeDots6 else 1;

Sqeezy1.SetPaintingStrategy(PaintingStrategy.POINTS);
Sqeezy1.AssignValueColor(if squeezeDots1 == 1 then Color.DARK_GREEN else Color.DARK_RED);
Sqeezy1.SetLineWeight(3);
Sqeezy2.SetPaintingStrategy(PaintingStrategy.POINTS);
Sqeezy2.AssignValueColor(if squeezeDots2 == 1 then Color.DARK_GREEN else Color.DARK_RED);
Sqeezy2.SetLineWeight(3);
Sqeezy3.SetPaintingStrategy(PaintingStrategy.POINTS);
Sqeezy3.AssignValueColor(if squeezeDots3 == 1 then Color.DARK_GREEN else Color.DARK_RED);
Sqeezy3.SetLineWeight(3);
Sqeezy4.SetPaintingStrategy(PaintingStrategy.POINTS);
Sqeezy4.AssignValueColor(if squeezeDots5 == 1 then Color.DARK_GREEN else Color.DARK_RED);
Sqeezy4.SetLineWeight(3);
Sqeezy5.SetPaintingStrategy(PaintingStrategy.POINTS);
Sqeezy5.AssignValueColor(if squeezeDots5 == 1 then Color.DARK_GREEN else Color.DARK_RED);
Sqeezy5.SetLineWeight(3);
Sqeezy6.SetPaintingStrategy(PaintingStrategy.POINTS);
Sqeezy6.AssignValueColor(if squeezeDots6 == 1 then Color.DARK_GREEN else  Color.DARK_RED);
Sqeezy6.SetLineWeight(3);
 

Join useThinkScript to post your question to a community of 21,000+ developers and traders.

Similar threads

Not the exact question you're looking for?

Start a new thread and receive assistance from our community.

87k+ Posts
220 Online
Create Post

Similar threads

Similar threads

The Market Trading Game Changer

Join 2,500+ subscribers inside the useThinkScript VIP Membership Club
  • Exclusive indicators
  • Proven strategies & setups
  • Private Discord community
  • ‘Buy The Dip’ signal alerts
  • Exclusive members-only content
  • Add-ons and resources
  • 1 full year of unlimited support

Frequently Asked Questions

What is useThinkScript?

useThinkScript is the #1 community of stock market investors using indicators and other tools to power their trading strategies. Traders of all skill levels use our forums to learn about scripting and indicators, help each other, and discover new ways to gain an edge in the markets.

How do I get started?

We get it. Our forum can be intimidating, if not overwhelming. With thousands of topics, tens of thousands of posts, our community has created an incredibly deep knowledge base for stock traders. No one can ever exhaust every resource provided on our site.

If you are new, or just looking for guidance, here are some helpful links to get you started.

What are the benefits of VIP Membership?
VIP members get exclusive access to these proven and tested premium indicators: Buy the Dip, Advanced Market Moves 2.0, Take Profit, and Volatility Trading Range. In addition, VIP members get access to over 50 VIP-only custom indicators, add-ons, and strategies, private VIP-only forums, private Discord channel to discuss trades and strategies in real-time, customer support, trade alerts, and much more. Learn all about VIP membership here.
How can I access the premium indicators?
To access the premium indicators, which are plug and play ready, sign up for VIP membership here.
Back
Top