Guppy Multiple Moving Averages Indicator for ThinkorSwim

diazlaz

Well-known member
2019 Donor
VIP
I ported the Guppy Multiple Moving a few months back, interested to see what you all can do with it to enhance it or maybe even identify potential trading plans and setup.

It's quite an interesting indicator; can be used to observe the patterns and ribbons across various timeframes, to formulate trend direction. Useful across all time frames and style of trading.

Quite a bit of patterns can be developed, and if you observe it enough reusable patterns form with ribbons and color overlap.

Please comment with your experiences and ideas. More information is available here.

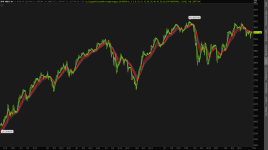
MSFT - 1 Minute (Intraday)

N1ywdpA.png


SPX - 1 Minute (Intraday)

V6aRusJ.png


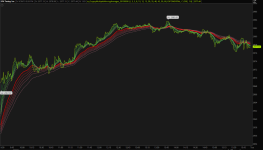
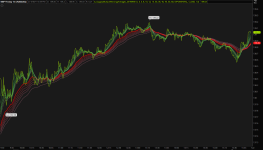
SPX - 1 Hour/6 Months (Swing Trading)

0RkDLVG.png


Code:
#Guppy Multiple Moving Averages
#Daryl Guppy, an Australian trader who is credited with its development.
#
#https://www.investopedia.com/terms/g/guppy-multiple-moving-average.asp
#Discussion: https://usethinkscript.com/threads/guppy-multiple-moving-averages-indicator.732/
#
#Ported on 20190427 V.01 - diazlaz
#

input period0 = 1;
input period1 = 3;
input period2 = 5;
input period3 = 8;
input period4 = 10;
input period5 = 12;
input period6 = 15;
input period7 = 30;
input period8 = 35;
input period9 = 40;
input period10 = 45;
input period11 = 50;
input period12 = 60;
input AvgType = AverageType.Exponential;
input data = close;
input seperator = 1.00;

script Avg
{
input AvgType = AverageType.Exponential;
input length = 10;
input data = close;
plot MA = MovingAverage(AverageType = AvgType, data = close, length = length);
}


DefineGlobalColor("Up", Color.GREEN);
DefineGlobalColor("Down", Color.RED);
DefineGlobalColor("NUp", Color.DARK_GREEN);
DefineGlobalColor("NDown", Color.DARK_RED);
DefineGlobalColor("Neutral", Color.BLUE);

DefineGlobalColor("G1", CreateColor(42,137,71));
DefineGlobalColor("G2", CreateColor(54,156,72));
DefineGlobalColor("G3", CreateColor(69,176,73));
DefineGlobalColor("G4", CreateColor(96,195,85));
DefineGlobalColor("G5", CreateColor(129,215,102));
DefineGlobalColor("G6", CreateColor(164,235,122));
DefineGlobalColor("R1", CreateColor(235,24,9));
DefineGlobalColor("R2", CreateColor(222,34,35));
DefineGlobalColor("R3", CreateColor(209,56,66));
DefineGlobalColor("R4", CreateColor(196,75,91));
DefineGlobalColor("R5", CreateColor(183,91,109));
DefineGlobalColor("R6", CreateColor(170,105,122));

HidePricePlot(yes);

plot MA0 = Avg(AvgType = AvgType, data = data, length = period0);
plot MA1 = Avg(AvgType = AvgType, data = data, length = period1);
plot MA2 = Avg(AvgType = AvgType, data = data, length = period2);
plot MA3 = Avg(AvgType = AvgType, data = data, length = period3);
plot MA4 = Avg(AvgType = AvgType, data = data, length = period4);
plot MA5 = Avg(AvgType = AvgType, data = data, length = period5);
plot MA6 = Avg(AvgType = AvgType, data = data, length = period6);
plot MA7 = Avg(AvgType = AvgType, data = data, length = period7);
plot MA8 = Avg(AvgType = AvgType, data = data, length = period8);
plot MA9 = Avg(AvgType = AvgType, data = data, length = period9);
plot MA10 = Avg(AvgType = AvgType, data = data, length = period10);
plot MA11 = Avg(AvgType = AvgType, data = data, length = period11);
plot MA12 = Avg(AvgType = AvgType, data = data, length = period12);

MA0.SetDefaultColor(COLOR.LIME);

MA1.SetDefaultColor(GlobalColor("G1"));
MA2.SetDefaultColor(GlobalColor("G2"));
MA3.SetDefaultColor(GlobalColor("G3"));
MA4.SetDefaultColor(GlobalColor("G4"));
MA5.SetDefaultColor(GlobalColor("G5"));

MA7.SetDefaultColor(COLOR.RED);
MA7.SetLineWeight(2);

MA8.SetDefaultColor(GlobalColor("R2"));
MA9.SetDefaultColor(GlobalColor("R3"));
MA10.SetDefaultColor(GlobalColor("R4"));
MA11.SetDefaultColor(GlobalColor("R5"));
MA12.SetDefaultColor(GlobalColor("R6"));

MA1.HideTitle();
MA2.HideTitle();
MA3.HideTitle();
MA4.HideTitle();
MA5.HideTitle();
MA6.HideTitle();
MA7.HideTitle();
MA8.HideTitle();
MA9.HideTitle();
MA10.HideTitle();
MA11.HideTitle();
MA12.HideTitle();

MA2.HideBubble();
MA3.HideBubble();
MA4.HideBubble();
MA5.HideBubble();
MA6.HideBubble();
MA8.HideBubble();
MA9.HideBubble();
MA10.HideBubble();
MA11.HideBubble();
MA12.HideBubble();

# End Code Guppy Multiple Moving Averages

Safe and Healthy trading!
 

Attachments

  • 0RkDLVG.png
    0RkDLVG.png
    375.2 KB · Views: 63
  • V6aRusJ.png
    V6aRusJ.png
    344.8 KB · Views: 47
  • N1ywdpA.png
    N1ywdpA.png
    390.6 KB · Views: 57
Last edited by a moderator:
Very nice with the clouds. I find it without the clouds its easier to spot the ribbon and touch points between the lines, when in a 4x4 or 4x8 grid, with multiple timeframes. In this edition, the candles and price chart is hidden exposing the ribbons. lower time frames are highlighted in green and higher timeframes in red, allowing for a clear delineation of when the lower ribbons cross with the higher timeframe ribbons.

7cMH0oT.png
 

Attachments

  • 7cMH0oT.png
    7cMH0oT.png
    387.7 KB · Views: 45
Thanks for keeping the Guppy in the Style that the original Author meant it to be. I've seen way too many people mess with it's intent.

To all: Please read the link to Investopedia at the top. It explains how Mr Guppy meant for it to be used. Thanks!
 
Last edited:
I watched some Guppy videos, and put this indicator on my TOS and it goes on fine, but my candles disappeared. Is there a fix for this issue?
 
Here is a Guppy Cloud (More of an EMA cloud) with some Labels that tell you which direction a particular EMA is trending

The actual EMA's used are slightly different than what one would find in a recommended guppy setup.

With this, Uptrends, Pullback's and Downtrends, really stand out.


Code:
#Guppy Cloud

input price = close;
input exp3 = 3;
input exp5 = 5;
input exp8 = 8;
input exp15 = 15;
input exp34 = 34;
input exp40 = 40;
input exp50 = 50;
input exp60 = 60;
input exp144 = 144;
input exp233 = 233;

input averageType = AverageType.EXPONENTIAL;

def exp3f = MovingAverage(averageType, price, exp3);
def exp5f = MovingAverage(averageType, price, exp5);
def exp8f = MovingAverage(averageType, price, exp8);
def exp15f = MovingAverage(averageType, price, exp15);
def exp34s = MovingAverage(averageType, price, exp34);
def exp40s = MovingAverage(averageType, price, exp40);
def exp50s = MovingAverage(averageType, price, exp50);
def exp60s = MovingAverage(averageType, price, exp60);
def exp233s = MovingAverage(averageType, price, exp233);
def exp144s = MovingAverage(averageType, price, exp144);

def long1f = exp3 > exp5;
def long2f = exp5 > exp8;
def long3f = exp8 > exp15;

def exp8up = exp8f > exp8f[1];
def exp15up = exp15f > exp15f[1];
def exp34up = exp34s > exp34s[1];
def exp50up = exp50s > exp50s[1];
def exp60up = exp60s > exp60s[1];
def exp144up = exp144s > exp144s[1];
def exp233up = exp233s > exp233s[1];

def exp8dn = exp8f < exp8f[1];
def exp15dn = exp15f < exp15f[1];
def exp34dn = exp34s < exp34s[1];
def exp50dn = exp50s < exp50s[1];
def exp60dn = exp60s < exp60s[1];
def exp144dn = exp144s < exp144s[1];
def exp233dn = exp233s < exp233s[1];

AddCloud( exp3f, exp5f, createColor(6,191,0), createColor(209,0,3));
AddCloud( exp5f, exp8f, createColor(6,176,0), createColor(186,0,3));
AddCloud( exp8f, exp15f, createColor(5,153,0), createColor(166,0,3));

AddCloud( exp15f, exp34s, createColor(4,130,0), createColor(145,0,2));
AddCloud( exp34s, exp40s, createColor(4,112,0), createColor(122,0,2));
AddCloud( exp40s, exp50s, createColor(3,97,0), createColor(102,0,2));
AddCloud( exp50s, exp60s, createColor(3,77,0), createColor(79,0,1));
AddCloud( exp60s, exp233s, createColor(2,56,0), createColor(61,0,1));


AddLabel (yes, if exp8up then "8 up" else if exp8dn then "8 Down"  else " ", if exp8up  then CreateColor(39,84,130) else if exp8dn then Color.DARK_RED else color.DARK_GRAY);
AddLabel (yes, if exp15up then "15 up" else if exp15dn then "15 Down"  else " ", if exp15up  then CreateColor(39,84,130) else if exp15dn then Color.DARK_RED else color.DARK_GRAY);
AddLabel (yes, if exp34up then "34 up" else if exp34dn then "34 Down"  else " ", if exp34up  then CreateColor(39,84,130) else if exp34dn then Color.DARK_RED else color.DARK_GRAY);
AddLabel (yes, if exp50up then "50 up" else if exp50dn then "50 Down"  else " ", if exp50up  then CreateColor(39,84,130) else if exp50dn then Color.DARK_RED else color.DARK_GRAY);
AddLabel (yes, if exp60up then "60 up" else if exp60dn then "60 Down"  else " ", if exp60up  then CreateColor(39,84,130) else if exp60dn then Color.DARK_RED else color.DARK_GRAY);

AddLabel (yes, if exp144up then "144 up" else if exp144dn then "144 Down"  else " ", if exp144up  then CreateColor(39,84,130) else if exp144dn then Color.DARK_RED else color.DARK_GRAY);


AddLabel (yes, if exp233up then "233 up" else if exp233dn then "233 Down"  else " ", if exp233up  then CreateColor(39,84,130) else if exp233dn then Color.DARK_RED else color.DARK_GRAY);


#============================================================

# End Code


ETSY, Clearly Trending as the main body of the Guppy is Green, Yellowish, orange at top of Guppy, indicates a pb/retracement at the very least
vzKNiwl.png


BIDU (pretty much solid green)
nFFLqsk.png


What a Bearish setup looks like
lykAmnM.png


Hope you find it usefull
 
Last edited:
I found this code for CM Super Guppy, does anyone know how to make this work in TOS?
Ruby:
//Daryl Guppy Super EMA's
study(title="CM Super Guppy", shorttitle="CM SuperGuppy", overlay=true)
src = close,
len1 = input(3, minval=1, title="Fast EMA 1")
len2 = input(6, minval=1, title="Fast EMA 2")
len3 = input(9, minval=1, title="Fast EMA 3")
len4 = input(12, minval=1, title="Fast EMA 4")
len5 = input(15, minval=1, title="Fast EMA 5")
len6 = input(18, minval=1, title="Fast EMA 6")
len7 = input(21, minval=1, title="Fast EMA 7")
//Slow EMA
len8 = input(24, minval=1, title="Slow EMA 8")
len9 = input(27, minval=1, title="Slow EMA 9")
len10 = input(30, minval=1, title="Slow EMA 10")
len11 = input(33, minval=1, title="Slow EMA 11")
len12 = input(36, minval=1, title="Slow EMA 12")
len13 = input(39, minval=1, title="Slow EMA 13")
len14 = input(42, minval=1, title="Slow EMA 14")
len15 = input(45, minval=1, title="Slow EMA 15")
len16 = input(48, minval=1, title="Slow EMA 16")
len17 = input(51, minval=1, title="Slow EMA 17")
len18 = input(54, minval=1, title="Slow EMA 18")
len19 = input(57, minval=1, title="Slow EMA 19")
len20 = input(60, minval=1, title="Slow EMA 20")
len21 = input(63, minval=1, title="Slow EMA 21")
len22 = input(66, minval=1, title="Slow EMA 22")
len23 = input(200, minval=1, title="EMA 200")

//Fast EMA
ema1 = ema(src, len1)
ema2 = ema(src, len2)
ema3 = ema(src, len3)
ema4 = ema(src, len4)
ema5 = ema(src, len5)
ema6 = ema(src, len6)
ema7 = ema(src, len7)

//Slow EMA
ema8 = ema(src, len8)
ema9 = ema(src, len9)
ema10 = ema(src, len10)
ema11 = ema(src, len11)
ema12 = ema(src, len12)
ema13 = ema(src, len13)
ema14 = ema(src, len14)
ema15 = ema(src, len15)
ema16 = ema(src, len16)
ema17 = ema(src, len17)
ema18 = ema(src, len18)
ema19 = ema(src, len19)
ema20 = ema(src, len20)
ema21 = ema(src, len21)
ema22 = ema(src, len22)

//EMA 200
ema23 = ema(src, len23)

//Fast EMA Color Rules
colfastL = (ema1 > ema2 and ema2 > ema3 and ema3 > ema4 and ema4 > ema5 and ema5 > ema6 and ema6 > ema7)
colfastS = (ema1 < ema2 and ema2 < ema3 and ema3 < ema4 and ema4 < ema5 and ema5 < ema6 and ema6 < ema7)
//Slow EMA Color Rules
colslowL = ema8 > ema9 and ema9 > ema10 and ema10 > ema11 and ema11 > ema12 and ema12 > ema13 and ema13 > ema14 and ema14 > ema15 and ema15 > ema16 and ema16 > ema17 and ema17 > ema18 and ema18 > ema19 and ema19 > ema20 and ema20 > ema21 and ema21 > ema22
colslowS = ema8 < ema9 and ema9 < ema10 and ema10 < ema11 and ema11 < ema12 and ema12 < ema13 and ema13 < ema14 and ema14 < ema15 and ema15 < ema16 and ema16 < ema17 and ema17 < ema18 and ema18 < ema19 and ema19 < ema20 and ema20 < ema21 and ema21 < ema22
//Fast EMA Final Color Rules
colFinal = colfastL and colslowL? aqua : colfastS and colslowS? orange : gray
//Slow EMA Final Color Rules
colFinal2 = colslowL ? lime : colslowS ? red : gray
//Fast EMA Plots
p1=plot(ema1, title="Fast EMA 1", style=line, linewidth=2, color=colFinal)
plot(ema2, title="Fast EMA 2", style=line, linewidth=1, color=colFinal)
plot(ema3, title="Fast EMA 3", style=line, linewidth=1, color=colFinal)
plot(ema4, title="Fast EMA 4", style=line, linewidth=1, color=colFinal)
plot(ema5, title="Fast EMA 5", style=line, linewidth=1, color=colFinal)
plot(ema6, title="Fast EMA 6", style=line, linewidth=1, color=colFinal)
p2=plot(ema7, title="Fast EMA 7", style=line, linewidth=2, color=colFinal)

//Slow EMA Plots
p3=plot(ema8, title="Slow EMA 8", style=line, linewidth=1, color=colFinal2)
plot(ema9, title="Slow EMA 9", style=line, linewidth=1, color=colFinal2)
plot(ema10, title="Slow EMA 10", style=line, linewidth=1, color=colFinal2)
plot(ema11, title="Slow EMA 11", style=line, linewidth=1, color=colFinal2)
plot(ema12, title="Slow EMA 12", style=line, linewidth=1, color=colFinal2)
plot(ema13, title="Slow EMA 13", style=line, linewidth=1, color=colFinal2)
plot(ema14, title="Slow EMA 14", style=line, linewidth=1, color=colFinal2)
plot(ema15, title="Slow EMA 15", style=line, linewidth=1, color=colFinal2)
plot(ema16, title="Slow EMA 16", style=line, linewidth=1, color=colFinal2)
plot(ema17, title="Slow EMA 17", style=line, linewidth=1, color=colFinal2)
plot(ema18, title="Slow EMA 18", style=line, linewidth=1, color=colFinal2)
plot(ema19, title="Slow EMA 19", style=line, linewidth=1, color=colFinal2)
plot(ema20, title="Slow EMA 20", style=line, linewidth=1, color=colFinal2)
plot(ema21, title="Slow EMA 21", style=line, linewidth=1, color=colFinal2)
plot(ema22, title="Slow EMA 22", style=line, linewidth=2, color=colFinal2)
p4=plot(ema23, title="EMA 200", style=line, linewidth=2)
 
Last edited by a moderator:
I found this code for CM Super Guppy, does anyone know how to make this work in TOS?
Ruby:
//Daryl Guppy Super EMA's
study(title="CM Super Guppy", shorttitle="CM SuperGuppy", overlay=true)
src = close,
len1 = input(3, minval=1, title="Fast EMA 1")
len2 = input(6, minval=1, title="Fast EMA 2")
len3 = input(9, minval=1, title="Fast EMA 3")
len4 = input(12, minval=1, title="Fast EMA 4")
len5 = input(15, minval=1, title="Fast EMA 5")
len6 = input(18, minval=1, title="Fast EMA 6")
len7 = input(21, minval=1, title="Fast EMA 7")
//Slow EMA
len8 = input(24, minval=1, title="Slow EMA 8")
len9 = input(27, minval=1, title="Slow EMA 9")
len10 = input(30, minval=1, title="Slow EMA 10")
len11 = input(33, minval=1, title="Slow EMA 11")
len12 = input(36, minval=1, title="Slow EMA 12")
len13 = input(39, minval=1, title="Slow EMA 13")
len14 = input(42, minval=1, title="Slow EMA 14")
len15 = input(45, minval=1, title="Slow EMA 15")
len16 = input(48, minval=1, title="Slow EMA 16")
len17 = input(51, minval=1, title="Slow EMA 17")
len18 = input(54, minval=1, title="Slow EMA 18")
len19 = input(57, minval=1, title="Slow EMA 19")
len20 = input(60, minval=1, title="Slow EMA 20")
len21 = input(63, minval=1, title="Slow EMA 21")
len22 = input(66, minval=1, title="Slow EMA 22")
len23 = input(200, minval=1, title="EMA 200")

//Fast EMA
ema1 = ema(src, len1)
ema2 = ema(src, len2)
ema3 = ema(src, len3)
ema4 = ema(src, len4)
ema5 = ema(src, len5)
ema6 = ema(src, len6)
ema7 = ema(src, len7)

//Slow EMA
ema8 = ema(src, len8)
ema9 = ema(src, len9)
ema10 = ema(src, len10)
ema11 = ema(src, len11)
ema12 = ema(src, len12)
ema13 = ema(src, len13)
ema14 = ema(src, len14)
ema15 = ema(src, len15)
ema16 = ema(src, len16)
ema17 = ema(src, len17)
ema18 = ema(src, len18)
ema19 = ema(src, len19)
ema20 = ema(src, len20)
ema21 = ema(src, len21)
ema22 = ema(src, len22)

//EMA 200
ema23 = ema(src, len23)

//Fast EMA Color Rules
colfastL = (ema1 > ema2 and ema2 > ema3 and ema3 > ema4 and ema4 > ema5 and ema5 > ema6 and ema6 > ema7)
colfastS = (ema1 < ema2 and ema2 < ema3 and ema3 < ema4 and ema4 < ema5 and ema5 < ema6 and ema6 < ema7)
//Slow EMA Color Rules
colslowL = ema8 > ema9 and ema9 > ema10 and ema10 > ema11 and ema11 > ema12 and ema12 > ema13 and ema13 > ema14 and ema14 > ema15 and ema15 > ema16 and ema16 > ema17 and ema17 > ema18 and ema18 > ema19 and ema19 > ema20 and ema20 > ema21 and ema21 > ema22
colslowS = ema8 < ema9 and ema9 < ema10 and ema10 < ema11 and ema11 < ema12 and ema12 < ema13 and ema13 < ema14 and ema14 < ema15 and ema15 < ema16 and ema16 < ema17 and ema17 < ema18 and ema18 < ema19 and ema19 < ema20 and ema20 < ema21 and ema21 < ema22
//Fast EMA Final Color Rules
colFinal = colfastL and colslowL? aqua : colfastS and colslowS? orange : gray
//Slow EMA Final Color Rules
colFinal2 = colslowL ? lime : colslowS ? red : gray
//Fast EMA Plots
p1=plot(ema1, title="Fast EMA 1", style=line, linewidth=2, color=colFinal)
plot(ema2, title="Fast EMA 2", style=line, linewidth=1, color=colFinal)
plot(ema3, title="Fast EMA 3", style=line, linewidth=1, color=colFinal)
plot(ema4, title="Fast EMA 4", style=line, linewidth=1, color=colFinal)
plot(ema5, title="Fast EMA 5", style=line, linewidth=1, color=colFinal)
plot(ema6, title="Fast EMA 6", style=line, linewidth=1, color=colFinal)
p2=plot(ema7, title="Fast EMA 7", style=line, linewidth=2, color=colFinal)

//Slow EMA Plots
p3=plot(ema8, title="Slow EMA 8", style=line, linewidth=1, color=colFinal2)
plot(ema9, title="Slow EMA 9", style=line, linewidth=1, color=colFinal2)
plot(ema10, title="Slow EMA 10", style=line, linewidth=1, color=colFinal2)
plot(ema11, title="Slow EMA 11", style=line, linewidth=1, color=colFinal2)
plot(ema12, title="Slow EMA 12", style=line, linewidth=1, color=colFinal2)
plot(ema13, title="Slow EMA 13", style=line, linewidth=1, color=colFinal2)
plot(ema14, title="Slow EMA 14", style=line, linewidth=1, color=colFinal2)
plot(ema15, title="Slow EMA 15", style=line, linewidth=1, color=colFinal2)
plot(ema16, title="Slow EMA 16", style=line, linewidth=1, color=colFinal2)
plot(ema17, title="Slow EMA 17", style=line, linewidth=1, color=colFinal2)
plot(ema18, title="Slow EMA 18", style=line, linewidth=1, color=colFinal2)
plot(ema19, title="Slow EMA 19", style=line, linewidth=1, color=colFinal2)
plot(ema20, title="Slow EMA 20", style=line, linewidth=1, color=colFinal2)
plot(ema21, title="Slow EMA 21", style=line, linewidth=1, color=colFinal2)
plot(ema22, title="Slow EMA 22", style=line, linewidth=2, color=colFinal2)
p4=plot(ema23, title="EMA 200", style=line, linewidth=2)[/CODE
[/QUOTE]
The super guppy is the exact same as the regular guppy multiple, just extra averages added in. Just copy and paste the average lines from the other entries and change the length
 
I use the code above on this forum and I added the extra MA's. When I select it nothing shows on the chart.

#Guppy Multiple Moving Averages
#Daryl Guppy, an Australian trader who is credited with its development.
#
#https://www.investopedia.com/terms/g/guppy-multiple-moving-average.asp
#Discussion: https://usethinkscript.com/threads/guppy-multiple-moving-averages-indicator.732/
#
#Ported on 20190427 V.01 - diazlaz
#

input period0 = 3;
input period1 = 6;
input period2 = 0;
input period3 = 12;
input period4 = 15;
input period5 = 18;
input period6 = 21;
input period7 = 24;
input period8 = 27;
input period9 = 30;
input period10 = 33;
input period11 = 36;
input period12 = 39;
input period13 = 42;
input period14 = 45;
input period15 = 48;
input AvgType = AverageType.EXPONENTIAL;
input period16 = 51;
input period17 = 54;
input period18 = 57;
input period19 = 60;
input period20 = 63;
input period21 = 66;
input period22 = 200;
input data = close;
input seperator = 1.00;

script Avg
{
input AvgType = AverageType.EXPONENTIAL;
input length = 10;
input data = close;
plot MA = MovingAverage(AverageType = AvgType, data = close, length = length);
}


DefineGlobalColor("Up", Color.GREEN);
DefineGlobalColor("Down", Color.RED);
DefineGlobalColor("NUp", Color.DARK_GREEN);
DefineGlobalColor("NDown", Color.DARK_RED);
DefineGlobalColor("Neutral", Color.BLUE);

DefineGlobalColor("G1", CreateColor(42, 137, 71));
DefineGlobalColor("G2", CreateColor(54, 156, 72));
DefineGlobalColor("G3", CreateColor(69, 176, 73));
DefineGlobalColor("G4", CreateColor(96, 195, 85));
DefineGlobalColor("G5", CreateColor(129, 215, 102));
DefineGlobalColor("G6", CreateColor(164, 235, 122));
DefineGlobalColor("R1", CreateColor(235, 24, 9));
DefineGlobalColor("R2", CreateColor(222, 34, 35));
DefineGlobalColor("R3", CreateColor(209, 56, 66));
DefineGlobalColor("R4", CreateColor(196, 75, 91));
DefineGlobalColor("R5", CreateColor(183, 91, 109));
DefineGlobalColor("R6", CreateColor(170, 105, 122));

HidePricePlot(no);

plot MA0 = Avg(AvgType = AvgType, data = data, length = period0);
plot MA1 = Avg(AvgType = AvgType, data = data, length = period1);
plot MA2 = Avg(AvgType = AvgType, data = data, length = period2);
plot MA3 = Avg(AvgType = AvgType, data = data, length = period3);
plot MA4 = Avg(AvgType = AvgType, data = data, length = period4);
plot MA5 = Avg(AvgType = AvgType, data = data, length = period5);
plot MA6 = Avg(AvgType = AvgType, data = data, length = period6);
plot MA7 = Avg(AvgType = AvgType, data = data, length = period7);
plot MA8 = Avg(AvgType = AvgType, data = data, length = period8);
plot MA9 = Avg(AvgType = AvgType, data = data, length = period9);
plot MA10 = Avg(AvgType = AvgType, data = data, length = period10);
plot MA11 = Avg(AvgType = AvgType, data = data, length = period11);
plot MA12 = Avg(AvgType = AvgType, data = data, length = period4);
plot MA13 = Avg(AvgType = AvgType, data = data, length = period5);
plot MA14 = Avg(AvgType = AvgType, data = data, length = period6);
plot MA15 = Avg(AvgType = AvgType, data = data, length = period7);
plot MA16 = Avg(AvgType = AvgType, data = data, length = period8);
plot MA17 = Avg(AvgType = AvgType, data = data, length = period9);
plot MA18 = Avg(AvgType = AvgType, data = data, length = period10);
plot MA19 = Avg(AvgType = AvgType, data = data, length = period11);
plot MA20 = Avg(AvgType = AvgType, data = data, length = period4);
plot MA21 = Avg(AvgType = AvgType, data = data, length = period5);
plot MA22 = Avg(AvgType = AvgType, data = data, length = period6);


MA0.SetDefaultColor(Color.LIME);

MA1.SetDefaultColor(GlobalColor("G1"));
MA2.SetDefaultColor(GlobalColor("G2"));
MA3.SetDefaultColor(GlobalColor("G3"));
MA4.SetDefaultColor(GlobalColor("G4"));
MA5.SetDefaultColor(GlobalColor("G5"));

MA7.SetDefaultColor(Color.RED);
MA7.SetLineWeight(2);

MA8.SetDefaultColor(GlobalColor("R2"));
MA9.SetDefaultColor(GlobalColor("R3"));
MA10.SetDefaultColor(GlobalColor("R4"));
MA11.SetDefaultColor(GlobalColor("R5"));
MA12.SetDefaultColor(GlobalColor("R6"));

MA1.HideTitle();
MA2.HideTitle();
MA3.HideTitle();
MA4.HideTitle();
MA5.HideTitle();
MA6.HideTitle();
MA7.HideTitle();
MA8.HideTitle();
MA9.HideTitle();
MA10.HideTitle();
MA11.HideTitle();
MA12.HideTitle();

MA2.HideBubble();
MA3.HideBubble();
MA4.HideBubble();
MA5.HideBubble();
MA6.HideBubble();
MA8.HideBubble();
MA9.HideBubble();
MA10.HideBubble();
MA11.HideBubble();
MA12.HideBubble();

# End Code Guppy Multiple Moving Averages
 
I use the code above on this forum and I added the extra MA's. When I select it nothing shows on the chart.
Here ya go:
CuZLYvW.png

Ruby:
#Guppy Multiple Moving Averages
#Daryl Guppy, an Australian trader who is credited with its development.
#
#https://www.investopedia.com/terms/g/guppy-multiple-moving-average.asp
#Discussion: https://usethinkscript.com/threads/guppy-multiple-moving-averages-indicator.732/
#
#Guppy Multiple Moving Averages
#Daryl Guppy, an Australian trader who is credited with its development.
#
#https://www.investopedia.com/terms/g/guppy-multiple-moving-average.asp
#Discussion: https://usethinkscript.com/threads/guppy-multiple-moving-averages-indicator.732/
#
#Ported on 20190427 V.01 - diazlaz
#

input period0 = 3;
input period1 = 6;
input period2 = 9;
input period3 = 12;
input period4 = 15;
input period5 = 18;
input period6 = 21;
input period7 = 24;
input period8 = 27;
input period9 = 30;
input period10 = 33;
input period11 = 36;
input period12 = 39;
input period13 = 42;
input period14 = 45;
input period15 = 48;
input period16 = 51;
input period17 = 54;
input period18 = 57;
input period19 = 60;
input period20 = 63;
input period21 = 66;
input period22 = 200;

input AvgType = AverageType.Exponential;
input data = close;
input seperator = 1.00;

script Avg
{
input AvgType = AverageType.Exponential;
input length = 10;
input data = close;
plot MA = MovingAverage(AverageType = AvgType, data = close, length = length);
}


DefineGlobalColor("Up", Color.GREEN);
DefineGlobalColor("Down", Color.RED);
DefineGlobalColor("NUp", Color.DARK_GREEN);
DefineGlobalColor("NDown", Color.DARK_RED);
DefineGlobalColor("Neutral", Color.BLUE);

DefineGlobalColor("G1", CreateColor(42,137,71));
DefineGlobalColor("G2", CreateColor(54,156,72));
DefineGlobalColor("G3", CreateColor(69,176,73));
DefineGlobalColor("G4", CreateColor(96,195,85));
DefineGlobalColor("G5", CreateColor(129,215,102));
DefineGlobalColor("G6", CreateColor(164,235,122));
DefineGlobalColor("R1", CreateColor(235,24,9));
DefineGlobalColor("R2", CreateColor(222,34,35));
DefineGlobalColor("R3", CreateColor(209,56,66));
DefineGlobalColor("R4", CreateColor(196,75,91));
DefineGlobalColor("R5", CreateColor(183,91,109));
DefineGlobalColor("R6", CreateColor(170,105,122));

HidePricePlot(No);

plot MA0 = Avg(AvgType = AvgType, data = data, length = period0);
plot MA1 = Avg(AvgType = AvgType, data = data, length = period1);
plot MA2 = Avg(AvgType = AvgType, data = data, length = period2);
plot MA3 = Avg(AvgType = AvgType, data = data, length = period3);
plot MA4 = Avg(AvgType = AvgType, data = data, length = period4);
plot MA5 = Avg(AvgType = AvgType, data = data, length = period5);
plot MA6 = Avg(AvgType = AvgType, data = data, length = period6);
plot MA7 = Avg(AvgType = AvgType, data = data, length = period7);
plot MA8 = Avg(AvgType = AvgType, data = data, length = period8);
plot MA9 = Avg(AvgType = AvgType, data = data, length = period9);
plot MA10 = Avg(AvgType = AvgType, data = data, length = period10);
plot MA11 = Avg(AvgType = AvgType, data = data, length = period11);
plot MA12 = Avg(AvgType = AvgType, data = data, length = period12);
plot MA13 = Avg(AvgType = AvgType, data = data, length = period13);
plot MA14 = Avg(AvgType = AvgType, data = data, length = period14);
plot MA15 = Avg(AvgType = AvgType, data = data, length = period15);
plot MA16 = Avg(AvgType = AvgType, data = data, length = period16);
plot MA17 = Avg(AvgType = AvgType, data = data, length = period17);
plot MA18 = Avg(AvgType = AvgType, data = data, length = period18);
plot MA19 = Avg(AvgType = AvgType, data = data, length = period19);
plot MA20 = Avg(AvgType = AvgType, data = data, length = period20);
plot MA21 = Avg(AvgType = AvgType, data = data, length = period21);
plot MA22 = Avg(AvgType = AvgType, data = data, length = period22);


MA0.SetDefaultColor(COLOR.LIME);

MA1.SetDefaultColor(GlobalColor("G1"));
MA2.SetDefaultColor(GlobalColor("G2"));
MA3.SetDefaultColor(GlobalColor("G3"));
MA4.SetDefaultColor(GlobalColor("G4"));
MA5.SetDefaultColor(GlobalColor("G5"));

MA7.SetDefaultColor(COLOR.RED);
MA7.SetLineWeight(2);

MA8.SetDefaultColor(GlobalColor("R2"));
MA9.SetDefaultColor(GlobalColor("R3"));
MA10.SetDefaultColor(GlobalColor("R4"));
MA11.SetDefaultColor(GlobalColor("R5"));
MA12.SetDefaultColor(GlobalColor("R6"));

MA1.HideTitle();
MA2.HideTitle();
MA3.HideTitle();
MA4.HideTitle();
MA5.HideTitle();
MA6.HideTitle();
MA7.HideTitle();
MA8.HideTitle();
MA9.HideTitle();
MA10.HideTitle();
MA11.HideTitle();
MA12.HideTitle();

MA2.HideBubble();
MA3.HideBubble();
MA4.HideBubble();
MA5.HideBubble();
MA6.HideBubble();
MA8.HideBubble();
MA9.HideBubble();
MA10.HideBubble();
MA11.HideBubble();
MA12.HideBubble();

# End Code Guppy Multiple Moving Averages
 

Join useThinkScript to post your question to a community of 21,000+ developers and traders.

Similar threads

Not the exact question you're looking for?

Start a new thread and receive assistance from our community.

87k+ Posts
305 Online
Create Post

Similar threads

Similar threads

The Market Trading Game Changer

Join 2,500+ subscribers inside the useThinkScript VIP Membership Club
  • Exclusive indicators
  • Proven strategies & setups
  • Private Discord community
  • ‘Buy The Dip’ signal alerts
  • Exclusive members-only content
  • Add-ons and resources
  • 1 full year of unlimited support

Frequently Asked Questions

What is useThinkScript?

useThinkScript is the #1 community of stock market investors using indicators and other tools to power their trading strategies. Traders of all skill levels use our forums to learn about scripting and indicators, help each other, and discover new ways to gain an edge in the markets.

How do I get started?

We get it. Our forum can be intimidating, if not overwhelming. With thousands of topics, tens of thousands of posts, our community has created an incredibly deep knowledge base for stock traders. No one can ever exhaust every resource provided on our site.

If you are new, or just looking for guidance, here are some helpful links to get you started.

What are the benefits of VIP Membership?
VIP members get exclusive access to these proven and tested premium indicators: Buy the Dip, Advanced Market Moves 2.0, Take Profit, and Volatility Trading Range. In addition, VIP members get access to over 50 VIP-only custom indicators, add-ons, and strategies, private VIP-only forums, private Discord channel to discuss trades and strategies in real-time, customer support, trade alerts, and much more. Learn all about VIP membership here.
How can I access the premium indicators?
To access the premium indicators, which are plug and play ready, sign up for VIP membership here.
Back
Top