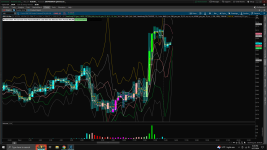
Repaints MTF Anticipated Price Level Indicator For ThinkOrSwim

Repaints
@DOUBLE MOVE - Scanner code is available, along with the screenshots and general info/guidelines. Please refer to the top post in this thread.

Thanks so i tried the new scanner code EXAMPLE and if i wanted to scan when price is greater than the hourly P_Higher_RR What tf multiplier would I use 60 ? or 5 default also I am on the 1 min chart with hourly P_Higher_RR ...so on the scan would I use the hourly scan or the 1 min to scan for that example I tried both Ways and the scanner code is not producing the results i wanted in either where PRICE is greater than P_Higher_RR . Thanks help is much appreciated
 
Last edited by a moderator:

Join useThinkScript to post your question to a community of 21,000+ developers and traders.

Thanks so i tried the new scanner code EXAMPLE and if i wanted to scan when price is greater than the hourly P_Higher_RR What tf multiplier would I use 60 ? or 5 default also I am on the 1 min chart with hourly P_Higher_RR ...so on the scan would I use the hourly scan or the 1 min to scan for that example I tried both Ways and the scanner code is not producing the results i wanted in either where PRICE is greater than
P_Higher_RR . Thanks help is much appreciated

I like the fact that you look at the code and try to make the most of it!

Please keep in mind that TOS is finicky about MTF in Scanners - specially with fold commands in the script - it triggers the complexity error.

So as an alternative the this scanner code uses "incremental pivots" and there are pros and cons. The disadvantage is that the results may or may not match the charts visually - it is a known limitation.

Here is the trick to get better results - keep your scan aggregation at 15M and Multiplier at 5 - this way you are close to what chart shows you for 15M - 4Bars. Reason - Incremental Pivots are close to aggregated pivotes but they cannot be exact. Personally I prefer them because they represent the tug-zone or push-pull zone better.

So to answer your question - For 1 min set the multiplier to 60 to see the projected result for next 60 candles but allow 20% +/- range so may be use 15M , 5Multiplier combo on the scanner so low number of folds are calculated and results should be comparable. play with it a bit.

Also, Higher_PP_I is a better criteria then Higher_RR_I. PP is the balance of SS (support) and RR (Resistance) Pivots. You can even do Close > Higher_PP_I instead of cross oever for faster results.

Let me know how it goes!
YAAAAAAAAAAAAAAAAAAA that worked awesome I used the 15 min with 4 multiplier THANKS SO MUCH!!!
 
YAAAAAAAAAAAAAAAAAAA that worked awesome I used the 15 min with 4 multiplier THANKS SO MUCH!!!
Same goes for the D level scans - I tried a few combinations even used 2hr x 4 TF Multiplier for Higher_RR_I cross over on S&P 500 and the results matched the chart. This was pretty bold criteria for a 6 hr session day specially when I ran it after hours. The idea is to keep the folds and the aggregation such that multiplier is in general less than 10 for faster calculations and pivot point vicinity. Quality results overall.
 
Trader Zen, what a wonderful effort! I am using your thinkscript with #Must Load as a Strategies #Modified Modius Supertrend With Reversal, Trend Direction AND mADX INDICATOR #10.27.2021 #V1.0
# MTF Anticipated Price Level with 24 Steps of 6 phases in a trade Cycle. # TraderZen
# Anticipated Level Indicator # Current Version: V3.0 # Created by TraderZen # Last update 8/21/2022
I am trading SPX and these indicators and strategies give me the edge! Thank you!
So glad to read this! What is the timeframe of your chart and the "next n bar" setting? 1min / 60 bars or something else? Have you tried it with the Smooth Sailing Indicator (5M HL on Smooth Sailing is a good conservative timeframe)? Good choice BTW - Modius Supertrend is a gift that keeps on giving.
 
I am using your Anticipated Price Level three times with different time settings.

B4 by C84_Christopher is my lower study that confirms your overall findings. The UseThinkScript team and all the players are the best! Everytime I go on your site i learn something new.
 
Last edited by a moderator:
What is the best proportion to set between the time period selected in ToS and the aggregation period you select inside the indicator?
 
What is the best proportion to set between the time period selected in ToS and the aggregation period you select inside the indicator?
for a 1 min chart it should be min 15 min aggregation - upto 60 is fine and is tested to work reliably. for a 15 min chart it should be minimum 60 minutes and for a 1 hour chart you should go for minimum 4 hours.
 
Is there a way to plot the Anticipated price level other than on the label? If you are following the price of the underlying the anticipated price level indicates a price in the next x bars (5 min would be 12 bars) set to 1hr. I am looking for a way to check the accuracy of this indicator and doing it manually is very tedious. Any ideas of help would be greatly appreciated. I was running a study on the SPX and it appears to be within 1% or less of the price.
 
Is there a way to plot the Anticipated price level other than on the label? If you are following the price of the underlying the anticipated price level indicates a price in the next x bars (5 min would be 12 bars) set to 1hr. I am looking for a way to check the accuracy of this indicator and doing it manually is very tedious. Any ideas of help would be greatly appreciated. I was running a study on the SPX and it appears to be within 1% or less of the price.
The green dotted line above; the red dotted line below the the price level and the middle multi colored line show the upper , mid and lower pivotes continuously. Please refer to the image in the first post.
 
Updated 5:00 8/21/2022 - V3.0 --> D+ level MTF & Anticipated_Level VWAP and Price of Interest (POI) Profiles.
Updated 10:55 8/17/2022 PST - % change in Label.
Updated 12:45 8/6/2022 PST - A calculation correction.


Current Anticipated Level Indicator version is V3.
Current Anticipate Level VWAP and POI Profiler code version is V1.
Both of the studies should be added at the chart level, the plots overlap with right levels of translusence.

View attachment 15363

Multi Time Frame Anticipated Price Level Indicator.
Color Coded Twenty Four Steps of trend Cycles from Bearish to Bullish and vice-versa.
Color coded six phases of a trade cycle.
Entry and Exit Points.
Trend Reversal Indications.


View attachment 15364
Code:
#
# Anticipated Level Indicator
# Current Version: V3.0
# Created by TraderZen
# Last update 8/21/2022
#


input applyPersonsLevelsFilter = yes;
input marketThreshold = 0.0025;
input timeFrame = AggregationPeriod.Fifteen_MIN;
input showLabel = {default "Yes", "No"};
input Show_Level_Lines = {default "All", "Mid", "High-Low", "None"};
input Show_Profiles = yes;


def CurrentTP = GetAggregationPeriod();
def thisTP;
thisTP = CurrentTP;

Def HigherTP = TimeFrame;

def PP2TP = high(period = thisTP)[1] + low(period = thisTP)[1] + close(period = thisTP)[1];
def marketTypeTP = { DISABLED,  NEUTRAL, BEARISH, default BULLISH};

marketTypeTP = if !applyPersonsLevelsFilter then marketTypeTP.DISABLED
                else if PP2TP[-1] > (PP2TP[-1] + PP2TP + PP2TP[1]) / 3 + marketThreshold then marketTypeTP.BULLISH
                else if PP2TP[-1] < (PP2TP[-1] + PP2TP + PP2TP[1]) / 3 - marketThreshold then marketTypeTP.BEARISH
                else marketTypeTP.NEUTRAL;

def AlgoExec = if HigherTP <= thisTP then no else yes;
AddLabel(yes, if AlgoExec == no then "No Execution: The Current Time Period Should be Less then the Selected Time Period! " + HigherTP else "Trend:" ,
        Color.WHITE) ;

def P = HigherTP / CurrentTP;

def Higher =  fold nH = 1 to P + 1 with Top_high     do  Max(high(Period = thisTP)[P], high(Period = thisTP)[P + 1]) ;
def Lower  =  fold nL = 1 to P + 1 with Bottom_Low   do  Min(low(Period = thisTP)[P], low(Period = thisTP)[P + 1]);
def closer  = close[1];

#def higher  = high(period = HigherTP)[1];
#def Lower   = low(period = HigherTP)[1];
#def Closer  =  close(period = HigherTP)[1];

#AddLabel(Yes, higher + " " + lower + " " + closer);

def PP2HP = Higher + Lower + closer;
def MarketTypeHP = { DISABLED,  NEUTRAL,  BEARISH, default BULLISH};

MarketTypeHP = if !applyPersonsLevelsFilter then MarketTypeHP.DISABLED
        else if PP2HP[-1] > (PP2HP[-1] + PP2HP + PP2HP[1]) / 3 + marketThreshold then MarketTypeHP.BULLISH
        else if PP2HP[-1] < (PP2HP[-1] + PP2HP + PP2HP[1]) / 3 - marketThreshold then MarketTypeHP.BEARISH
        else MarketTypeHP.NEUTRAL;

#def paintingStrategy1 = if getAggregationPeriod() == AggregationPeriod.Min then PaintingStrategy.LINE_VS_TRIANGLES
#                       else if getAggregationPeriod() == AggregationPeriod.FIVE_MIN
#                            or getAggregationPeriod() == AggregationPeriod.FIFTEEN_MIN then
#                            PaintingStrategy.LINE_VS_SQUARES
#                       else PaintingStrategy.LINE;
def paintingStrategy1 = PaintingStrategy.LINE;

#def paintingStrategy2 = if HigherTP == AggregationPeriod.Min then PaintingStrategy.LINE_VS_TRIANGLES
#                       else if HigherTP == AggregationPeriod.Five_Min or HigherTP == AggregationPeriod.Fifteen_Min then PaintingStrategy.LINE_VS_SQUARES
#                       else PaintingStrategy.LINE;
def paintingStrategy2 = PaintingStrategy.LINE;

## -- Pivote points + Trigger points + phase to calculate Trend.

## -- Initiate Variables

def HigherTP_PP;
def HigherTP_R1;
def HigherTP_R2;
def HigherTP_R3;
def HigherTP_S1;
def HigherTP_S2;
def HigherTP_S3;
def HigherTP_RR;
def HigherTP_SS;

def HigherTP_PP_I;
def HigherTP_R1_I;
def HigherTP_R2_I;
def HigherTP_R3_I;
def HigherTP_S1_I;
def HigherTP_S2_I;
def HigherTP_S3_I;
def HigherTP_RR_I;
def HigherTP_SS_I;

## -- Conditionally Assign Values

if AlgoExec == no # or !IsNaN(close(period = HigherTP)[-1])
Then
{

    HigherTP_PP = Double.NaN;
    HigherTP_R1 = Double.NaN;
    HigherTP_R2 = Double.NaN;
    HigherTP_R3 = Double.NaN;
    HigherTP_S1 = Double.NaN;
    HigherTP_S2 = Double.NaN;
    HigherTP_S3 = Double.NaN;
    HigherTP_RR = Double.NaN;
    HigherTP_SS = Double.NaN;

    HigherTP_PP_I = Double.NaN;
    ;
    HigherTP_R1_I = Double.NaN;
    HigherTP_R2_I = Double.NaN;
    ;
    HigherTP_R3_I = Double.NaN;
    ;
    HigherTP_S1_I = Double.NaN;
    ;
    HigherTP_S2_I = Double.NaN;
    ;
    HigherTP_S3_I = Double.NaN;
    ;
    HigherTP_RR_I = Double.NaN;
    ;
    HigherTP_SS_I = Double.NaN;
    ;


}
else
{

    HigherTP_PP = (high(period = HigherTP)[1] + low(period = HigherTP)[1] + close(period = HigherTP)[1]) / 3;
    ;
    HigherTP_R1 = 2 * HigherTP_PP - low(period = HigherTP)[1];
    ;
    HigherTP_R2 = HigherTP_PP + high(period = HigherTP)[1] - low(period = HigherTP)[1];
    HigherTP_R3 = HigherTP_R2 + high(period = HigherTP)[1] - low(period = HigherTP)[1];
    HigherTP_S1 = 2 * HigherTP_PP - high(period = HigherTP)[1];
    HigherTP_S2 = HigherTP_PP - high(period = HigherTP)[1] + low(period = HigherTP)[1];
    HigherTP_S3 = HigherTP_S2 - high(period = HigherTP)[1] + low(period = HigherTP)[1];
    HigherTP_RR = if (MarketTypeHP == MarketTypeHP.BEARISH or MarketTypeHP == MarketTypeHP.NEUTRAL) then HigherTP_R1 else HigherTP_R2;
    HigherTP_SS = if (MarketTypeHP == MarketTypeHP.BULLISH or MarketTypeHP == MarketTypeHP.NEUTRAL) then HigherTP_S1 else HigherTP_S2;

    HigherTP_PP_I = (Higher[1] + Lower[1] + closer[1]) / 3;
    ;
    HigherTP_R1_I = 2 * HigherTP_PP - Lower[1];
    ;
    HigherTP_R2_I = HigherTP_PP + Higher[1] - Lower[1];
    HigherTP_R3_I = HigherTP_R2 + Higher[1] - Lower[1];
    HigherTP_S1_I = 2 * HigherTP_PP - Higher[1];
    HigherTP_S2_I = HigherTP_PP - Higher[1] + Lower[1];
    HigherTP_S3_I = HigherTP_S2 - Higher[1] + Lower[1];
    HigherTP_RR_I = if (MarketTypeHP == MarketTypeHP.BEARISH or MarketTypeHP == MarketTypeHP.NEUTRAL) then HigherTP_R1 else HigherTP_R2;
    HigherTP_SS_I = if (MarketTypeHP == MarketTypeHP.BULLISH or MarketTypeHP == MarketTypeHP.NEUTRAL) then HigherTP_S1 else HigherTP_S2;

}


plot P_HigherTP_PP = if (Show_Level_Lines == Show_Level_Lines."All" or Show_Level_Lines  == Show_Level_Lines."Mid" ) then HigherTP_PP else Double.nan;
plot P_HigherTP_R1 = HigherTP_R1;
plot P_HigherTP_R2 = HigherTP_R2;
plot P_HigherTP_R3 = HigherTP_R3;
plot P_HigherTP_S1 = HigherTP_S1;
plot P_HigherTP_S2 = HigherTP_S2;
plot P_HigherTP_S3 = HigherTP_S3;
plot P_HigherTP_RR = if (Show_Level_Lines == Show_Level_Lines."All" or Show_Level_Lines  == Show_Level_Lines."High-Low") then HigherTP_RR else double.nan;
plot P_HigherTP_SS = if (Show_Level_Lines == Show_Level_Lines."All" or Show_Level_Lines  == Show_Level_Lines."High-Low") then HigherTP_SS else double.nan;

plot P_HigherTP_PP_I = HigherTP_PP_I;
plot P_HigherTP_R1_I = HigherTP_R1_I;
plot P_HigherTP_R2_I = HigherTP_R2_I;
plot P_HigherTP_R3_I = HigherTP_R3_I;
plot P_HigherTP_S1_I = HigherTP_S1_I;
plot P_HigherTP_S2_I = HigherTP_S2_I;
plot P_HigherTP_S3_I = HigherTP_S3_I;
plot P_HigherTP_RR_I = HigherTP_RR_I;
plot P_HigherTP_SS_I = HigherTP_SS_I;


P_HigherTP_RR.SetHiding(!applyPersonsLevelsFilter);
P_HigherTP_R1.SetHiding(applyPersonsLevelsFilter);
P_HigherTP_R2.SetHiding(applyPersonsLevelsFilter);
P_HigherTP_SS.SetHiding(!applyPersonsLevelsFilter);
P_HigherTP_S1.SetHiding(applyPersonsLevelsFilter);
P_HigherTP_S2.SetHiding(applyPersonsLevelsFilter);


P_HigherTP_PP.SetDefaultColor(GetColor(3));
P_HigherTP_R1.SetDefaultColor(GetColor(5));
P_HigherTP_R2.SetDefaultColor(GetColor(5));
P_HigherTP_R3.SetDefaultColor(GetColor(6));
P_HigherTP_S1.SetDefaultColor(GetColor(5));
P_HigherTP_S2.SetDefaultColor(GetColor(5));
P_HigherTP_S3.SetDefaultColor(GetColor(5));

P_HigherTP_SS.DefineColor("P_HigherTP_S1", GetColor(5));
P_HigherTP_SS.DefineColor("P_HigherTP_S2", GetColor(5));
P_HigherTP_SS.AssignValueColor(if P_HigherTP_SS == P_HigherTP_S1 then P_HigherTP_SS.Color("P_HigherTP_S1") else P_HigherTP_SS.Color("P_HigherTP_S2"));

P_HigherTP_RR.DefineColor("P_HigherTP_R1", GetColor(6));
P_HigherTP_RR.DefineColor("P_HigherTP_R2", GetColor(6));
P_HigherTP_RR.AssignValueColor(if P_HigherTP_RR == P_HigherTP_R1 then P_HigherTP_RR.Color("P_HigherTP_R1") else P_HigherTP_RR.Color("P_HigherTP_R2"));

P_HigherTP_PP.SetStyle(Curve.LONG_DASH);
P_HigherTP_RR.SetStyle(Curve.SHORT_DASH);
P_HigherTP_R1.SetStyle(Curve.SHORT_DASH);
P_HigherTP_R2.SetStyle(Curve.SHORT_DASH);
P_HigherTP_R3.SetStyle(Curve.SHORT_DASH);
P_HigherTP_SS.SetStyle(Curve.SHORT_DASH);
P_HigherTP_S1.SetStyle(Curve.SHORT_DASH);
P_HigherTP_S2.SetStyle(Curve.SHORT_DASH);
P_HigherTP_S3.SetStyle(Curve.SHORT_DASH);


P_HigherTP_PP.SetPaintingStrategy(paintingStrategy2);
P_HigherTP_RR.SetPaintingStrategy(paintingStrategy2);
P_HigherTP_R1.SetPaintingStrategy(paintingStrategy2);
P_HigherTP_R2.SetPaintingStrategy(paintingStrategy2);
P_HigherTP_R3.SetPaintingStrategy(paintingStrategy2);
P_HigherTP_SS.SetPaintingStrategy(paintingStrategy2);
P_HigherTP_S1.SetPaintingStrategy(paintingStrategy2);
P_HigherTP_S2.SetPaintingStrategy(paintingStrategy2);
P_HigherTP_S3.SetPaintingStrategy(paintingStrategy2);


P_HigherTP_S1.Hide();
P_HigherTP_S2.Hide();
P_HigherTP_S3.Hide();
P_HigherTP_R1.Hide();
P_HigherTP_R2.Hide();
P_HigherTP_R3.Hide();
#P_HigherTP_rr.hide();
#P_HigherTP_ss.hide();
#P_HigherTP_pp.hide();


P_HigherTP_S1_I.Hide();
P_HigherTP_S2_I.Hide();
P_HigherTP_S3_I.Hide();
P_HigherTP_R1_I.Hide();
P_HigherTP_R2_I.Hide();
P_HigherTP_R3_I.Hide();
P_HigherTP_RR_I.Hide();
P_HigherTP_SS_I.Hide();
P_HigherTP_PP_I.Hide();

## -- Arrangement to reference the higher timeframe data (AP = AggergationPeriod).

def BullCalc = MovingAverage(3, PP2TP[-1] / 3, 3);
def BearCalc = MovingAverage(3, ( (PP2TP[-1] + PP2TP + PP2TP[1]) / 3) / 3 , 3);

rec BullCalcHP = MovingAverage(3, PP2HP[-1] / 3, 3);
rec BearCalcHP = MovingAverage(3, ( (PP2HP[-1] + PP2HP + PP2HP[1]) / 3) / 3 , 3);

plot p_bullC = BullCalc;
p_bullC.AssignValueColor(Color.WHITE);

plot p_BearC = BearCalc;
p_BearC.AssignValueColor(Color.GRAY);


plot P_BullCHP = BullCalcHP;
P_BullCHP.AssignValueColor(Color.WHITE);

plot p_BearCHP = BearCalcHP;
p_BearCHP.AssignValueColor(Color.YELLOW);


plot P_Close = close(priceType = PriceType.LAST);


rec bull = if (BullCalc[-1] crosses above BearCalc[-1] - marketThreshold) then yes else Double.NaN;
rec bear = if (BearCalc[-1] crosses above BullCalc[-1] - marketThreshold) then yes else Double.NaN;

rec BullHP = if  (BullCalcHP[-1] crosses above (BearCalcHP[-1] - marketThreshold))  then yes
             else Double.NaN;
def BearHP = if (BearCalcHP[-1] crosses above (BullCalcHP[-1] - marketThreshold))  then yes else Double.NaN;


plot P_bull = bull;
plot p_bear =  bear ;

plot P_BullHP = BullHP ;
plot p_BearHP = BearHP ;

P_bull.SetPaintingStrategy(PaintingStrategy.BOOLEAN_ARROW_UP);
P_bull.SetDefaultColor(Color.GREEN);
p_bear.SetDefaultColor(Color.DARK_ORANGE);
p_bear.SetPaintingStrategy(PaintingStrategy.BOOLEAN_ARROW_DOWN);

P_BullHP.SetPaintingStrategy(PaintingStrategy.BOOLEAN_ARROW_UP);
P_BullHP.SetDefaultColor(Color.CYAN);
p_BearHP.SetDefaultColor(Color.MAGENTA);
p_BearHP.SetPaintingStrategy(PaintingStrategy.BOOLEAN_ARROW_DOWN);

p_bullC.Hide();
p_BearC.Hide();

P_bull.Hide();
p_bear.Hide();

P_BullHP.Hide();
p_BearHP.Hide();

P_BullCHP.Hide();
p_BearCHP.Hide();

######################################### ------ Color coding

def C = P_Close;

def v50  = Round(SimpleMovingAvg(close, 50)); # MovAvgExponential(close, 50);
def v100 = Round(SimpleMovingAvg(close, 100));
def v200 = Round(SimpleMovingAvg(close, 200)); # MovAvgExponential(close, 200);
def F = v50;  # Duplicate variable for v50 to code the SeqNum Logic.
def H = v100; # Duplicate variable for v100 to code the SeqNum Logic.
def T = v200; # Duplicate variable for v200 to code the seqNum Logic.
def BB = Round(BollingerBands()."MidLine");

def ROCFlag = if RateOfChange() > RateOfChange()[1] then 1
              else if RateOfChange() < RateOfChange()[1] then -1
              else 0;

def ROCFlag2 = if RateOfChange() > 0 then 1
               else if RateOfChange() < 0 then -1
               else 0;

def MACDOpen = if MACD()."value" >= MACD()."value"[1] and MACD()."value" > MACD()."avg" then 1
               else if MACD()."value" <  MACD()."value"[1] and MACD()."value" < MACD()."avg" then -1
               else 0;

def PlayzoneFlag = if  ROCFlag == 1 and MACDOpen == 1  then 2
                   else if ROCFlag2 == 1 and MACDOpen == 1 then 2
                   else if ROCFlag == -1 and MACDOpen == -1 then -2
                   else if ROCFlag2 == -1 and MACDOpen == -1 then -2
                   else 0;

def Phase = if (close >= v50  and close >= v200 and v50   >= v200) then 1 #Bullish
       else if (close >= v50  and close >= v200 and v50   <= v200) then 2 #Accumulation
       else if (  v50 <= v200 and close <= v200 and close >= v50)  then 3 # Recovery
       else if (close <= v50  and close >= v200 and v50   >= v200) then 4 # Warning
       else if (close <= v50  and close <= v200 and v50   >= v200) then 5 #Distribution
       else if (  v50 <= v200 and close <= v200 and close <= v50 ) then 6 #Bearish
       else 7;

def ScalpCode = if ( (C >= BB) and (BB > BB[1])  and (BB >= F) ) then 101 # Bullish Superseed condition
         else if ( (F >= BB) and (BB[1] >= BB) and (BB >= C) ) then -101 # Bearish Superseed condition
         else if ( (C >= BB) and (BB >= F) ) then 100 #Still Bullish Strong
         else if ( (F >= BB) and (BB >= C) ) then -100 #Still Bearish Strong
         else if ( close >= Highest(close[1], 50)) then 75 #C50 Up
         else if ( close <= Lowest(close[1], 50)) then -75  #c50 Down
         else if ( BB >= BB[1]) then 50 #Uptrend
         else if ( BB[1] >= BB) then -50 #DownTrend
         else 0;

def SeqNum =  if ((C >= F) and (F >= H) and (H >= T)) then 1 #Step-3 Bullish phase Confirmed [1] (C-F-H-T)
         else if ((C >= F) and (F >= T) and (T >= H)) then 2 #Step-2 Bullish Confirmation AKA Accumuation [2] (C-F-T-H)
         else if ((C >= H) and (H >= F) and (F >= T)) or
                 (close >= Highest(close[1], 50))     then 3 #Ambiguous Bullish. Check the C, Phase, Playzone and Higher Time-Frame. (C-H-F-T)
         else if ((C >= H) and (H >= T) and (T >= F)) then 4 #Ambiguous Bullish. Check the Phase, Playzone and Higher Time-Frame. (C-H-T-F)
         else if ((C >= T) and (T >= F) and (F >= H)) then 5 #Step-3 Bullish Breakout and re-test AKA Bullish [1] (C-T-F-H)
         else if ((C >= T) and (T >= H) and (H >= F)) then 6 #Step-1 Bullish Initiation AKA Recovery [3] (C-T-H-F)

         else if ((F >= C) and (C >= H) and (H >= T)) then 7 #Step-4.5 Bullish Maturation AKA Bullish (F-C-H-T)
         else if ((F >= C) and (C >= T) and (T >= H)) or
                 (close <= Lowest(close[1], 50))      then 8 #step-9 Bearish Maturation AKA Bearish. Check the C.[6] (F-C-T-H)
         else if ((F >= H) and (H >= C) and (C >= T)) then 9 #Step-4.5 Bullish Maturation [PullBack, Not Real Distribution] [4] (F-H-C-T)
         else if ((F >= H) and (H >= T) and (T >= C)) then 10 #Step-6 Bearish Initiation AKA Warning [4] (F-H-T-C)
         else if ((F >= T) and (T >= C) and (C >= H)) then 11 #Ambiguous-11 Check the Phase, Playzone and Higher Time-Frame(F-T-C-H)
         else if ((F >= T) and (T >= H) and (H >= C)) then 12 #Step-7 Bearish Breakout and Re-test AKA Bearish [6]

         else if ((H >= C) and (C >= F) and (F >= T)) then 13 #Step-4 Bullish Maturation AKA Bullish [1] (H-C-F-T)
         else if ((H >= C) and (C >= T) and (T >= F)) then 14 #Ambiguous-14 Check the Phase, Playzone and Higher Time-Frame(H-C-T-F)
         else if ((H >= F) and (F >= C) and (C >= T)) then 15 #Step-5 Bullish Exhaustion (H-F-C-T) Review!
         else if ((H >= F) and (F >= T) and (T >= C)) then 16 #Step-6.5 Bearish Comfirmation AKA Distribution (H-F-T-C)
         else if ((H >= T) and (T >= C) and (C >= F)) then 17 #Step-9.5 Bearish Exhaustion Confirmed (H-T-C-F)
         else if ((H >= T) and (T >= F) and (F >= C)) then 18 #Ambiguous-18 Check the Phase, Playzone and Higher Time-Frame(H-T-F-C)

         else if ((T >= C) and (C >= F) and (F >= H)) then 19 #Step-0.5 - Attempting to be Bullish. Watch ROC/MACD  [1] (T-C-F-H)
         else if ((T >= C) and (C >= H) and (H >= F)) then 20 #Step-10 - Attempting to be Bullish. Watch ROC/MACD [1] (T-C-H-F)
         else if ((T >= F) and (F >= C) and (C >= H)) then 21 #Step-4.5 Bullish Maturation [PullBack, Not Real Distribution] [4] (T-F-C-H)
         else if ((T >= F) and (F >= H) and (H >= C)) then 22 #Ambiguous Bearish. Check the Phase, Playzone and Higher Time-Frame. (T-G-H-C)
         else if ((T >= H) and (H >= C) and (C >= F)) then 23 #Ambiguoua-23 (T-H-C-F)
         else if ((T >= H) and (H >= F) and (F >= C)) then 24 #Step-9 Bearish Maturation [6] (T-H-F-c)

         else 0;


P_Close.AssignValueColor( if ScalpCode == 100 or ScalpCode == 75 then Color.GREEN
                      else if ScalpCode == 101 then Color.CYAN
                      else if ScalpCode == -100 or ScalpCode == -75 then Color.RED
                      else if ScalpCode == -101 then Color.PLUM
                      else if ScalpCode == 50 then Color.LIGHT_GREEN
                      else if ScalpCode == -50 then Color.PINK
                      else Color.LIGHT_GRAY);


P_HigherTP_PP.AssignValueColor( if SeqNum == 1 or  SeqNum == .5 then Color.CYAN
                            else if SeqNum == 2 or  SeqNum == 2.5 then Color.LIGHT_GREEN
                            else if SeqNum == 3 then Color.GREEN
                            else if SeqNum == 4 or  SeqNum == 4.5 then Color.LIGHT_GREEN
                            else if SeqNum == 5 or  SeqNum == 5.1 then Color.CYAN
                            else if SeqNum == 6 then Color.GREEN
                            else if SeqNum == 7 then Color.LIME
                            else if SeqNum == 8 then Color.RED
                            else if SeqNum == 9 or  SeqNum == 9.5 then Color.LIGHT_RED
                            else if SeqNum == 10 then Color.RED
                            else if SeqNum == 11 then Color.GRAY
                            else if SeqNum == 12 then Color.MAGENTA
                            else if SeqNum == 13 then Color.GREEN
                            else if SeqNum == 14 then Color.GRAY
                            else if SeqNum == 15 then Color.YELLOW
                            else if SeqNum == 16 then Color.MAGENTA
                            else if SeqNum == 17 then Color.YELLOW
                            else if SeqNum == 18 then Color.GRAY
                            else if SeqNum == 19 then Color.LIGHT_GREEN
                            else if SeqNum == 20 then Color.LIGHT_GREEN
                            else if SeqNum == 21 then Color.RED
                            else if SeqNum == 22 then Color.LIGHT_RED
                            else if SeqNum == 23 then Color.GRAY
                            else if SeqNum == 24 then Color.MAGENTA
                            else if SeqNum == 0 then Color.GRAY
                           else Color.LIGHT_GRAY
 
);

AddLabel(if showLabel == showLabel."Yes" then yes else no, SeqNum + " " +
    if SeqNum == 1 then "Bullish Confirmed"
         else if SeqNum == 2 then "Accumuation"
         else if SeqNum == 3 then "Ambiguous+Bullish"
         else if SeqNum == 4 then "Ambiguous+Bullish"
         else if SeqNum == 5 then "Bullish Breakout & Re-test"
         else if SeqNum == 6 then "Bullish Initiation"

         else if SeqNum == 7 then "Bullish Maturation"
         else if SeqNum == 8 then "Bearish Maturation"
         else if SeqNum == 9 then "PullBack,Not Real Distribution"
         else if SeqNum == 10 then "Bearish Initiation"
         else if SeqNum == 11 then "Ambiguous! May be in a channel"
         else if SeqNum == 12 then "Bearish Breakout & Re-test"

         else if SeqNum == 13 then "Bullish Maturation"
         else if SeqNum == 14 then "Ambiguous! May be in a channel"
         else if SeqNum == 15 then "Potential Reversal! Bullish Exhaustion"
         else if SeqNum == 16 then "Bearish Comfirmation/Distribution"
         else if SeqNum == 17 then "Bearish Exhaustion Confirmed"
         else if SeqNum == 18 then "Ambiguous-Bearish/Bearish Channel"

         else if SeqNum == 19 and PlayzoneFlag == 2 then "About to be Bullish"
         else if SeqNum == 19 and PlayzoneFlag == -2 then "About to be Bearish"
         else if SeqNum == 19 and PlayzoneFlag == 0 then "Ambiguous. Check Higher TF"
         else if SeqNum == 19 then "Ambiguous.Check Higher TF"
         else if SeqNum == 20 and PlayzoneFlag == 2 then "Bullish Attempt may fail"
         else if SeqNum == 20 and PlayzoneFlag == -2 then "Bearish attempt may fail"
         else if SeqNum == 20 and PlayzoneFlag == 0 then "Ambiguous. *Check Higher TF"
         else if SeqNum == 20 then "Ambiguous. Check Higher TF"
 
         else if SeqNum == 21 then "Bullish Maturation/PullBack, Not Real Distribution"
         else if SeqNum == 22 then "Ambiguous-Bearish. *Check Higher TF"
         else if SeqNum == 23 then "Ambiguous. Check Higher TF"
         else if SeqNum == 24 then "Bearish Trend. Check Higher TF"
         else "*" ,

         if SeqNum == 1 or  SeqNum == .5 then Color.CYAN
                            else if SeqNum == 2 or  SeqNum == 2.5 then Color.LIGHT_GREEN
                            else if SeqNum == 3 then Color.GREEN
                            else if SeqNum == 4 or  SeqNum == 4.5 then Color.LIGHT_GREEN
                            else if SeqNum == 5 or  SeqNum == 5.1 then Color.CYAN
                            else if SeqNum == 6 then Color.GREEN
                            else if SeqNum == 7 then Color.LIME
                            else if SeqNum == 8 then Color.RED
                            else if SeqNum == 9 or  SeqNum == 9.5 then Color.LIGHT_RED
                            else if SeqNum == 10 then Color.RED
                            else if SeqNum == 11 then Color.GRAY
                            else if SeqNum == 12 then Color.MAGENTA
                            else if SeqNum == 13 then Color.GREEN
                            else if SeqNum == 14 then Color.GRAY
                            else if SeqNum == 15 then Color.YELLOW
                            else if SeqNum == 16 then Color.MAGENTA
                            else if SeqNum == 17 then Color.YELLOW
                            else if SeqNum == 18 then Color.GRAY
                            else if SeqNum == 19 then Color.LIGHT_GREEN
                            else if SeqNum == 20 then Color.LIGHT_GREEN
                            else if SeqNum == 21 then Color.RED
                            else if SeqNum == 22 then Color.LIGHT_RED
                            else if SeqNum == 23 then Color.GRAY
                            else if SeqNum == 24 then Color.MAGENTA
                            else if SeqNum == 0 then Color.GRAY
                           else Color.LIGHT_GRAY );

input MACDBB_FastLength = 12;
input MACDBB_SlowLength = 26;
input MACDBB_BandLength = 9;
input MACDBB_NumDev = 1.0;

Def HigherTP_PP_BB_High = reference BollingerBands(price = P_HigherTP_RR, length = MACDBB_BandLength,
                                             Num_Dev_Dn = -MACDBB_NumDev, Num_Dev_Up = MACDBB_NumDev).UpperBand;

def HigherTP_PP_BB_LOW = reference BollingerBands(price = P_HigherTP_SS, length = MACDBB_BandLength,
                                             Num_Dev_Dn = -MACDBB_NumDev, Num_Dev_Up = MACDBB_NumDev).Lowerband;

AddLabel(if showLabel == showLabel."Yes" then yes else no,
     
         if P_Close >= HigherTP_PP and P_Close <= HigherTP_RR then "Anticipated Level: " + HigherTP_RR  + " (" + roundup( ((HigherTP_RR - P_Close)/P_Close)*100,2) + " %)" + " in next " + p + " Bars"
         else if P_Close <= HigherTP_PP and P_Close >= HigherTP_SS then "Anticipated Level: " + HigherTP_SS + " (" + roundup( ((HigherTP_SS - P_Close)/P_Close)*100,2) + " %)" + " in next " + p + " Bars"
         else if P_Close >= P_HigherTP_PP and P_Close >= HigherTP_RR then "Anticipated Level: " + HigherTP_PP_Bb_HIgh + " (" + roundup( ((HigherTP_PP_BB_High - P_Close)/P_Close)*100, 2) + " %)" + "* in next " + p + " Bars"
         else if P_Close <= P_HigherTP_PP and P_Close <= HigherTP_SS then "Anticipated Level: " +
                            HigherTP_PP_BB_Low  + " (" + roundup( ((HigherTP_PP_BB_Low - P_Close)/P_Close)*100,2) + " %)" + "* in next " + p + " Bars"
         else "Anticipated Level:",
         if P_Close >= HigherTP_PP then GetColor(6) else GetColor(5) );

P_Close.SetPaintingStrategy(paintingStrategy2);
P_Close.SetLineWeight(1);
P_BullCHP.SetLineWeight(1);
P_BullCHP.AssignValueColor(Color.WHITE);
P_Close.Hide();


# --- Cross over logic --
rec _Cross_Up = if P_Close crosses above P_HigherTP_PP_I then yes else no;
def Cross_Up = if _Cross_Up != _Cross_Up[1] then _Cross_Up else Double.NaN;

def  Cross_Dn = if P_Close crosses below P_HigherTP_PP_I then yes else no;
#Cross_Up.SetPaintingStrategy(PaintingStrategy.BOOLEAN_ARROW_UP);
#Cross_Dn.SetPaintingStrategy(PaintingStrategy.BOOLEAN_ARROW_DOWN);

def upArrow = if Cross_up then low else double.NaN;
def dnArrow = if Cross_Dn then high else double.NaN;

plot PPSup = upArrow;
Plot PPSdown = dnArrow;
PPSup.SetPaintingStrategy(PaintingStrategy.ARROW_UP);
PPSdown.SetPaintingStrategy(PaintingStrategy.ARROW_DOWN);
PPSup.SetLineWeight(3);
PPSDown.SetLineWeight(3);
PPSUp.AssignValueColor(Color.White);
PPSDown.AssignValueColor(Color.White);


#-- Paint Bars logic --
input PaintBars = { default "Yes", "No" } ;

AssignPriceColor(
        if PaintBars == PaintBars."Yes" then

         if ScalpCode == 100 or ScalpCode == 75 then Color.GREEN
                      else if ScalpCode == 101 then Color.CYAN
                      else if ScalpCode == -100 or ScalpCode == -75 then Color.RED
                      else if ScalpCode == -101 then Color.MAGENTA
                      else if ScalpCode == 50 then Color.LIGHT_GREEN
                      else if ScalpCode == -50 then Color.PINK
                      else Color.LIGHT_GRAY    
 
        else Color.CURRENT# RB
    );

#End 8/21/20222

The Anticipated Level POI and WVAP Profiler code is available below -

View attachment 15365
Code:
# AL_Profiler
# Current Version: V1.0
# Goes with Anticipated Level Indicator
# Created by: TraderZen
# Last Update: 8/21/2022
# -- Show Profile ----

#------Start Function List---------------

input pricePerRowHeightMode = {AUTOMATIC, default TICKSIZE, CUSTOM};
input customRowHeight = 1.0;
input aggregationPeriod = {default "1 min", "2 min", "3 min", "4 min", "5 min", "10 min", "15 min", "20 min",  "30 min", "1 hour", "2 hours", "4 hours", "Day", "2 Days", "3 Days", "4 Days", "Week", "Month"};
input timePerProfile = {CHART, MINUTE, HOUR, DAY, WEEK, MONTH, "OPT EXP", default BAR, YEAR};
input multiplier = 6;
input onExpansion = no;
input profiles = 500;
input showMonkeyBar = yes;
input showThePlayground = yes;
input thePlaygroundPercent = 70;
input opacity = 25;
input emphasizeFirstDigit = no;
input markOpenPrice = no;
input markClosePrice = no;
input volumeShowStyle = MonkeyVolumeShowStyle.NONE;
input showVolumeVA = yes;
input showVolumePoc = yes;
input theVolumePercent = 70;
input showInitialBalance = no;
input initialBalanceRange = 1;

def period;
def yyyymmdd = GetYYYYMMDD();
def seconds = SecondsFromTime(0);
def month = GetYear() * 12 + GetMonth();
def day_number = DaysFromDate(First(yyyymmdd)) + GetDayOfWeek(First(yyyymmdd));
def dom = GetDayOfMonth(yyyymmdd);
def dow = GetDayOfWeek(yyyymmdd - dom + 1);
def expthismonth = (if dow > 5 then 27 else 20) - dow;
def exp_opt = month + (dom > expthismonth);
def periodMin = Floor(seconds / 60 + day_number * 24 * 60);
def periodHour = Floor(seconds / 3600 + day_number * 24);
def periodDay = CountTradingDays(Min(First(yyyymmdd), yyyymmdd), yyyymmdd) - 1;
def periodWeek = Floor(day_number / 7);
def periodMonth = month - First(month);

switch (timePerProfile) {
case CHART:
    period = 0;
case MINUTE:
    period = periodMin;
case HOUR:
    period = periodHour;
case DAY:
    period = periodDay;
case WEEK:
    period = periodWeek;
case MONTH:
    period = periodMonth;
case "OPT EXP":
    period = exp_opt - First(exp_opt);
case BAR:
    period = BarNumber() - 1;
case YEAR:
    period = GetYear() - First(GetYear());
}

input RthBegin  = 0930;
input RthEnd    = 1600;
#input Minutes = 6;
#input showBubbles = no;
def OpenRange = SecondsFromTime(0930) >= 0 and
                SecondsFromTime(1000) >= 0;
def bar = BarNumber();
def RTHBar1 = if SecondsFromTime(RthBegin) == 0 and
                 SecondsTillTime(RthBegin) == 0
              then bar
              else RTHBar1[1];
def RTHBarEnd = if SecondsFromTime(RthEnd) == 0 and
                   SecondsTillTime(RthEnd) == 0
                then 1
                else Double.NaN;
def RTH = SecondsFromTime(RthBegin) > 0 and
          SecondsTillTime(RthEnd) > 0;
def start_t = if RTH and !RTH[1]
              then GetTime()
              else start_t[1];
def t = if start_t == GetTime()
        then 1
        else GetTime() % (Multiplier * 60 * 1000) == 0;
def cond = t;

def height;
switch (pricePerRowHeightMode) {
case AUTOMATIC:
    height = PricePerRow.AUTOMATIC;
case TICKSIZE:
    height = PricePerRow.TICKSIZE;
case CUSTOM:
    height = customRowHeight;
}

def timeInterval;
def aggMultiplier;
switch (aggregationPeriod) {
case "1 min":
    timeInterval = periodMin;
    aggMultiplier = 1;
case "2 min":
    timeInterval = periodMin;
    aggMultiplier = 2;
case "3 min":
    timeInterval = periodMin;
    aggMultiplier = 3;
case "4 min":
    timeInterval = periodMin;
    aggMultiplier = 4;
case "5 min":
    timeInterval = periodMin;
    aggMultiplier = 5;
case "10 min":
    timeInterval = periodMin;
    aggMultiplier = 10;
case "15 min":
    timeInterval = periodMin;
    aggMultiplier = 15;
case "20 min":
    timeInterval = periodMin;
    aggMultiplier = 20;
case "30 min":
    timeInterval = periodMin;
    aggMultiplier = 30;
case "1 hour":
    timeInterval = periodHour;
    aggMultiplier = 1;
case "2 hours":
    timeInterval = periodHour;
    aggMultiplier = 2;
case "4 hours":
    timeInterval = periodHour;
    aggMultiplier = 4;
case "Day":
    timeInterval = periodDay;
    aggMultiplier = 1;
case "2 Days":
    timeInterval = periodDay;
    aggMultiplier = 2;
case "3 Days":
    timeInterval = periodDay;
    aggMultiplier = 3;
case "4 Days":
    timeInterval = periodDay;
    aggMultiplier = 4;
case "Week":
    timeInterval = periodWeek;
    aggMultiplier = 1;
case "Month":
    timeInterval = periodMonth;
    aggMultiplier = 1;
}
def agg_count = CompoundValue(1, if timeInterval != timeInterval[1]
                                 then (GetValue(agg_count, 1) + timeInterval -
                                                  timeInterval[1]) % aggMultiplier
                                 else GetValue(agg_count, 1), 0);
def agg_cond = CompoundValue(1,  agg_count < agg_count[1] + timeInterval -
                                                            timeInterval[1], yes);
def digit = CompoundValue(1, if cond
                             then 1
                             else agg_cond + GetValue(digit, 1), 1);
profile monkey = MonkeyBars(digit,
                "startNewProfile" = cond,
                "onExpansion" = onExpansion,
                "numberOfProfiles" = profiles,
                "pricePerRow" = height,
                "the playground percent" = thePlaygroundPercent,
                "emphasize first digit" = emphasizeFirstDigit,
                "volumeProfileShowStyle" = volumeShowStyle,
                "volumePercentVA" = theVolumePercent,
                "show initial balance" = showInitialBalance,
                "initial balance range" = initialBalanceRange);
def con = CompoundValue(1, onExpansion, no);
def mbar = CompoundValue(1, if IsNaN(monkey.GetPointOfControl()) and con then GetValue(mbar, 1) else monkey.GetPointOfControl(), monkey.GetPointOfControl());
def hPG = CompoundValue(1, if IsNaN(monkey.GetHighestValueArea()) and con then GetValue(hPG, 1) else monkey.GetHighestValueArea(), monkey.GetHighestValueArea());
def lPG = CompoundValue(1, if IsNaN(monkey.GetLowestValueArea()) and con then GetValue(lPG, 1) else monkey.GetLowestValueArea(), monkey.GetLowestValueArea());
def hProfile = CompoundValue(1, if IsNaN(monkey.GetHighest()) and con then GetValue(hProfile, 1) else monkey.GetHighest(), monkey.GetHighest());
def lProfile = CompoundValue(1, if IsNaN(monkey.GetLowest()) and con then GetValue(lProfile, 1) else monkey.GetLowest(), monkey.GetLowest());
def plotsDomain = IsNaN(close) == onExpansion;

def VWAP_Data = vwap(period = getAggregationPeriod());
profile vwap_Profile = DataProfile(data = vwap_data,
                "startNewProfile" = t,
                "onExpansion" = onExpansion,
                "numberOfProfiles" = profiles
                 );
plot vwap_poc = VWAP_Profile.getPointofControl();
vwap_poc.setpaintingStrategy(paintingStrategy.LINE_Vs_Triangles);
vwap_poc.assignValueColor(color.white);
plot vWap_p = vwap_data;
vwap_p.setpaintingStrategy(paintingStrategy.LINE_Vs_points);
vwap_p.setlineWeight(2);
VWAP_p.assignValueColor(if vwap_p >= vwap_p[1] then color.cyan else color.magenta);
vWAP_P.hide();

def VWAPbar = CompoundValue(1, if IsNaN(vwap_profile.GetPointOfControl()) and con then GetValue(VWAPBAR, 1) else vwap_profile.GetPointOfControl(), vwap_profile.GetPointOfControl());


profile tpo = TimeProfile("startNewProfile" = t,
                          "onExpansion" = 0,
                          "numberOfProfiles" = profiles,
                          "pricePerRow" =  tickSize(),
                          "value area percent" = 70);
def showPointOfControl = yes;
def showValueArea = no;

plot ProfileHigh = if plotsDomain then hProfile else Double.NaN;
plot ProfileLow = if plotsDomain then lProfile else Double.NaN;
plot PGHigh = if plotsDomain then hPG else Double.NaN;
plot PGLow = if plotsDomain then lPG else Double.NaN;

DefineGlobalColor("Monkey Bar", GetColor(4));
DefineGlobalColor("The Playground", GetColor(3));
DefineGlobalColor("Open Price", GetColor(1));
DefineGlobalColor("Close Price", GetColor(1));
DefineGlobalColor("Volume", GetColor(8));
DefineGlobalColor("Volume Value Area", GetColor(2));
DefineGlobalColor("Volume Point of Control", GetColor(3));
DefineGlobalColor("Initial Balance", GetColor(7));
DefineGlobalColor("Profiles", GetColor(1));

tpo.Show(GlobalColor("Profiles"), if showPointOfControl
                                 then GlobalColor("Volume Point Of Control")
                                 else Color.CURRENT,
                                 if showValueArea
                                 then GlobalColor("Volume Value Area")
                                 else Color.CURRENT, opacity);

plot MB = if plotsDomain then mbar else Double.NaN;


MB.SetDefaultColor(GlobalColor("Monkey Bar"));
MB.SetPaintingStrategy(PaintingStrategy.Line_vs_Points);
PGHigh.SetPaintingStrategy(PaintingStrategy.HORIZONTAL);
PGLow.SetPaintingStrategy(PaintingStrategy.HORIZONTAL);
PGHigh.SetDefaultColor(GlobalColor("The Playground"));
PGLow.SetDefaultColor(GlobalColor("The Playground"));
ProfileHigh.SetPaintingStrategy(PaintingStrategy.HORIZONTAL);
ProfileLow.SetPaintingStrategy(PaintingStrategy.HORIZONTAL);
ProfileHigh.SetDefaultColor(GetColor(3));
ProfileLow.SetDefaultColor(GetColor(3));
ProfileHigh.Hide();
ProfileLow.Hide();
PGHigh.hide();
PGLow.hide();


#-----end function list ---------------

#--- end 8/21/2022

Scanner code --
Select a timeframe
Select a multiplier >=2 (default is 5) Scan will use anticipated price value Support and Resistances based on the multiplier (multiplier means the number of bars for the timeframe).


View attachment 15366

View attachment 15367


Code:
#
# Created by TraderZen
# Last update 8/23/2022
# Scanner for Anticipated Price Levels
#
#

input applyPersonsLevelsFilter = yes;
input marketThreshold = 0.0025;
input tf_Multiplier = 5;
input showLabel = {default "Yes", "No"};
input Show_Level_Lines = {default "All", "Mid", "High-Low", "None"};

def CurrentTP = GetAggregationPeriod();

def thisTP;
thisTP = GetAggregationPeriod();


Def HigherTP = ThisTp * tf_Multiplier;

def PP2TP = high(period = thisTP)[1] + low(period = thisTP)[1] + close(period = thisTP)[1];
def marketTypeTP = { DISABLED,  NEUTRAL, BEARISH, default BULLISH};

marketTypeTP = if !applyPersonsLevelsFilter then marketTypeTP.DISABLED
                else if PP2TP[-1] > (PP2TP[-1] + PP2TP + PP2TP[1]) / 3 + marketThreshold then marketTypeTP.BULLISH
                else if PP2TP[-1] < (PP2TP[-1] + PP2TP + PP2TP[1]) / 3 - marketThreshold then marketTypeTP.BEARISH
                else marketTypeTP.NEUTRAL;

def AlgoExec = if HigherTP <= thisTP then no else yes;
#AddLabel(yes, if AlgoExec == no then "No Execution: The Current Time Period Should be Less then the Selected Time Period! " + HigherTP else "Trend:" ,
#        Color.WHITE) ;

def P = HigherTP / CurrentTP;

def Higher =  fold nH = 1 to P + 1 with Top_high     do  Max(high(Period = thisTP)[P], high(Period = thisTP)[P + 1]) ;
def Lower  =  fold nL = 1 to P + 1 with Bottom_Low   do  Min(low(Period = thisTP)[P], low(Period = thisTP)[P + 1]);
def closer  = close[1];


#AddLabel(Yes, higher + " " + lower + " " + closer);

def PP2HP = Higher + Lower + closer;
def MarketTypeHP = { DISABLED,  NEUTRAL,  BEARISH, default BULLISH};

MarketTypeHP = if !applyPersonsLevelsFilter then MarketTypeHP.DISABLED
        else if PP2HP[-1] > (PP2HP[-1] + PP2HP + PP2HP[1]) / 3 + marketThreshold then MarketTypeHP.BULLISH
        else if PP2HP[-1] < (PP2HP[-1] + PP2HP + PP2HP[1]) / 3 - marketThreshold then MarketTypeHP.BEARISH
        else MarketTypeHP.NEUTRAL;

def paintingStrategy1 = PaintingStrategy.LINE;

#def paintingStrategy2 = if HigherTP == AggregationPeriod.Min then PaintingStrategy.LINE_VS_TRIANGLES
#                       else if HigherTP == AggregationPeriod.Five_Min or HigherTP == AggregationPeriod.Fifteen_Min then PaintingStrategy.LINE_VS_SQUARES
#                       else PaintingStrategy.LINE;
def paintingStrategy2 = PaintingStrategy.LINE;

## -- Pivote points + Trigger points + phase to calculate Trend.

## -- Initiate Variables

def HigherTP_PP_I;
def HigherTP_R1_I;
def HigherTP_R2_I;
def HigherTP_R3_I;
def HigherTP_S1_I;
def HigherTP_S2_I;
def HigherTP_S3_I;
def HigherTP_RR_I;
def HigherTP_SS_I;

## -- Conditionally Assign Values

if AlgoExec == no # or !IsNaN(close(period = HigherTP)[-1])
Then
{


    HigherTP_PP_I = Double.NaN;
    HigherTP_R1_I = Double.NaN;
    HigherTP_R2_I = Double.NaN;
 
    HigherTP_R3_I = Double.NaN;
 
    HigherTP_S1_I = Double.NaN;
 
    HigherTP_S2_I = Double.NaN;
    HigherTP_S3_I = Double.NaN;
   
    HigherTP_RR_I = Double.NaN;
 
    HigherTP_SS_I = Double.NaN;


}
else
{

    HigherTP_PP_I = (Higher[1] + Lower[1] + close[1]) / 3;
    HigherTP_R1_I = 2 * HigherTP_PP_I - Lower[1];
    HigherTP_R2_I = HigherTP_PP_I + Higher[1] - Lower[1];
    HigherTP_R3_I = HigherTP_R2_I + Higher[1] - Lower[1];
    HigherTP_S1_I = 2 * HigherTP_PP_I - Higher[1];
    HigherTP_S2_I = HigherTP_PP_I - Higher[1] + Lower[1];
    HigherTP_S3_I = HigherTP_S2_I - Higher[1] + Lower[1];
    HigherTP_RR_I = if (MarketTypeHP == MarketTypeHP.BEARISH or MarketTypeHP == MarketTypeHP.NEUTRAL) then HigherTP_R1_I else HigherTP_R2_I;
    HigherTP_SS_I = if (MarketTypeHP == MarketTypeHP.BULLISH or MarketTypeHP == MarketTypeHP.NEUTRAL) then HigherTP_S1_I else HigherTP_S2_I;

}


plot P_HigherTP_PP_I = HigherTP_PP_I;
plot P_HigherTP_R1_I = HigherTP_R1_I;
plot P_HigherTP_R2_I = HigherTP_R2_I;
plot P_HigherTP_R3_I = HigherTP_R3_I;
plot P_HigherTP_S1_I = HigherTP_S1_I;
plot P_HigherTP_S2_I = HigherTP_S2_I;
plot P_HigherTP_S3_I = HigherTP_S3_I;
plot P_HigherTP_RR_I = HigherTP_RR_I;
plot P_HigherTP_SS_I = HigherTP_SS_I;


#P_HigherTP_S1_I.Hide();
#P_HigherTP_S2_I.Hide();
#P_HigherTP_S3_I.Hide();
#P_HigherTP_R1_I.Hide();
#P_HigherTP_R2_I.Hide();
#P_HigherTP_R3_I.Hide();
#P_HigherTP_RR_I.Hide();
#P_HigherTP_SS_I.Hide();
#P_HigherTP_PP_I.Hide();

## -- Arrangement to reference the higher timeframe data (AP = AggergationPeriod).

plot P_Close = close(priceType = PriceType.LAST);


######################################### ------ Color coding

P_Close.AssignValueColor( Color.LIGHT_GRAY);
P_HigherTP_PP_I.AssignValueColor(Color.LIGHT_GRAY);
 
input MACDBB_FastLength = 12;
input MACDBB_SlowLength = 26;
input MACDBB_BandLength = 9;
input MACDBB_NumDev = 1.0;

Def HigherTP_PP_BB_High = reference BollingerBands(price = P_HigherTP_RR_I, length = MACDBB_BandLength,
                                            Num_Dev_Dn = -MACDBB_NumDev, Num_Dev_Up = MACDBB_NumDev).UpperBand;
def HigherTP_PP_BB_LOW = reference BollingerBands(price = P_HigherTP_SS_I, length = MACDBB_BandLength,
                                             Num_Dev_Dn = -MACDBB_NumDev, Num_Dev_Up = MACDBB_NumDev).Lowerband;

P_Close.SetPaintingStrategy(paintingStrategy2);
P_Close.SetLineWeight(1);

#End 8/23/20222
Hi, While creating the new scanner ,i am getting an error " exactly one plot expected" Am i doing something wrong ?
 
Hi, While creating the new scanner ,i am getting an error " exactly one plot expected" Am i doing something wrong ?
Generally, the "exactly one plot expected" is seen when an attempt is made to cut&paste a chart study into the scan hacker.
Here is a tutorial on how to scan custom studies:
https://usethinkscript.com/threads/how-to-use-thinkorswim-stock-hacker-scans.284/.

In this case, even if you set it up successfully; you will still get errors.
MTF studies cannot be used in the scan hacker.
 
Why does mine look like this lol
 

Attachments

  • Screenshot (55) - Copy.png
    Screenshot (55) - Copy.png
    503.1 KB · Views: 161
The error message is right on the screen. The time-period of the chart should be less than the selected time period for calculations.

In case someone may not kiow what the error message's 900,000 means, which is 15 minutes, perhaps changing the addlabel message as follows
Code:
AddLabel(yes, if AlgoExec == no then "No Execution: The Current Time Period Should be Less then the Selected Time Period of " + HigherTP/60000 +"m !" else "Trend:" ,
        Color.WHITE) ;
Before
Screenshot 2024-04-10 100435.png


After
Screenshot 2024-04-10 100839.png
 

Similar threads

Not the exact question you're looking for?

Start a new thread and receive assistance from our community.

87k+ Posts
350 Online
Create Post

Similar threads

Similar threads

The Market Trading Game Changer

Join 2,500+ subscribers inside the useThinkScript VIP Membership Club
  • Exclusive indicators
  • Proven strategies & setups
  • Private Discord community
  • ‘Buy The Dip’ signal alerts
  • Exclusive members-only content
  • Add-ons and resources
  • 1 full year of unlimited support

Frequently Asked Questions

What is useThinkScript?

useThinkScript is the #1 community of stock market investors using indicators and other tools to power their trading strategies. Traders of all skill levels use our forums to learn about scripting and indicators, help each other, and discover new ways to gain an edge in the markets.

How do I get started?

We get it. Our forum can be intimidating, if not overwhelming. With thousands of topics, tens of thousands of posts, our community has created an incredibly deep knowledge base for stock traders. No one can ever exhaust every resource provided on our site.

If you are new, or just looking for guidance, here are some helpful links to get you started.

What are the benefits of VIP Membership?
VIP members get exclusive access to these proven and tested premium indicators: Buy the Dip, Advanced Market Moves 2.0, Take Profit, and Volatility Trading Range. In addition, VIP members get access to over 50 VIP-only custom indicators, add-ons, and strategies, private VIP-only forums, private Discord channel to discuss trades and strategies in real-time, customer support, trade alerts, and much more. Learn all about VIP membership here.
How can I access the premium indicators?
To access the premium indicators, which are plug and play ready, sign up for VIP membership here.
Back
Top