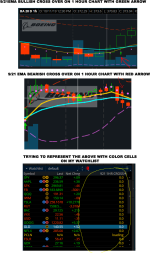
If anyone uses EMA crossover as a way to identify trend or point of entry/exit, knowing when there is a moving average crossover on your watchlist column can certainly be helpful. Here is a quick snippet that let you do just that.
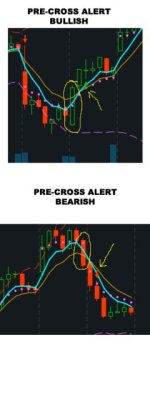
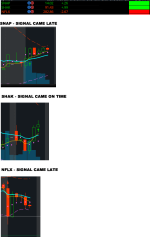
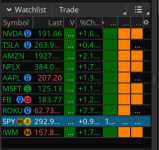
It includes lookback period so that you can set to X amount of when there is an EMA (exponential moving average) crossover. For example, the default is 5. The column will turn green when there is a bullish crossover within the last 5 bars and vice versa. Orange for neutral.
shared watchlist column: http://tos.mx/!nhq5ktdd MUST follow these instructions for loading shared links.

The default values for EMAs are 10 and 20. You can change the input to whichever EMA you use on your chart.
In case you don't want to check for moving average crossover but price moving above or below a specific moving average, you can use the alternative code below.
This script will highlight the column green if the current stock price is above the 200 simple moving average. If the price is below the 200 SMA, the column will turn red.
It includes lookback period so that you can set to X amount of when there is an EMA (exponential moving average) crossover. For example, the default is 5. The column will turn green when there is a bullish crossover within the last 5 bars and vice versa. Orange for neutral.
shared watchlist column: http://tos.mx/!nhq5ktdd MUST follow these instructions for loading shared links.
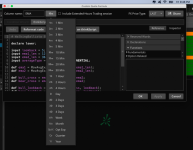
thinkScript Code
Rich (BB code):
# WalkingBallista EMA Lookback Cross
# https://usethinkscript.com/d/119-moving-average-crossover-watchlist-column-for-thinkorswim

declare lower;

input lookback = 5;
input ema1_len = 10;
input ema2_len = 20;
input averageType = AverageType.EXPONENTIAL;

def ema1 = MovAvgExponential(length=ema1_len);
def ema2 = MovAvgExponential(length=ema2_len);

def bull_cross = ema1 crosses above ema2;
def bear_cross = ema1 crosses below ema2;

def bull_lookback = highest(bull_cross, lookback);
def bear_lookback = highest(bear_cross, lookback);

plot signal = if bull_lookback then 2 else if bear_lookback then 1 else 0;
signal.AssignValueColor(if signal == 2 then Color.Dark_Green else if signal == 1 then Color.Dark_Red else Color.Dark_Orange);
AssignBackgroundCOlor(if signal == 2 then Color.Dark_Green else if signal == 1 then Color.Dark_Red else Color.Dark_Orange);
The default values for EMAs are 10 and 20. You can change the input to whichever EMA you use on your chart.
In case you don't want to check for moving average crossover but price moving above or below a specific moving average, you can use the alternative code below.
This script will highlight the column green if the current stock price is above the 200 simple moving average. If the price is below the 200 SMA, the column will turn red.
Code:
input price = close;
input length = 200;
input displace = 0;

plot SMA = Average(price[-displace], length);
AssignBackgroundColor(if price > SMA then color.dark_green else color.dark_red);
Attachments
Last edited by a moderator: