Moving Average Crossover Watchlist Column for ThinkorSwim

Is there a way to add an alert to notify me when this is triggered?
I am using this in the MarketWatch of ToS.
Thank you for the Guidance. I had to make some slight changes to the code you posted, and it works great now. I used the following code:

Code:
def EMA8 = ExpAverage(close, 8);
def EMA13 = ExpAverage(close, 13);
def EMA21 = ExpAverage(close, 21);
def EMA34 = ExpAverage(close, 34);
def EMA55 = ExpAverage(close, 55);
def EMA89 = ExpAverage(close, 89);

def bullish = EMA8 CROSSES ABOVE EMA13 and EMA13 > EMA21 and EMA21 > EMA34 and EMA34 > EMA55 and EMA55 > EMA89;
def bearish = EMA8 CROSSES BELOW EMA13 and EMA13 < EMA21 and EMA21 < EMA34 and EMA34 < EMA55 and EMA55 < EMA89;
There are Three Types of Alerts:
1. There are alerts written into studies. They only alert when the chart w/ the study is open on your screen
They cannot be sent to phone/email. They cannot have custom sounds.​
2. There are alerts created on a chart for one specific stock that you want to alert on.
3. There are scanned watchlist alerts which alert whenever the results of the scan changes.
These alerts can be 3min delayed. They can have custom sounds, they can be sent to phone/email, if you have notifications turned on in the app setup.​


1. The alert written into a study
add to the bottom of your script:
Ruby:
# Alert
Alert(bullish, "bullish", Alert.Bar, Sound.Chimes);
Alert(bullish, "bearish", Alert.Bar, Sound.Chimes);

2. Alert created on a chart:
change def bullish to plot bullish
right-click on chart.
click on create alert
cut&paste your script

3. Scanned watchlist alert
change def bullish to plot bullish
open Scan Hacker
cut&paste your script
click on the menu icon above the results and click on alerts
 

Join useThinkScript to post your question to a community of 21,000+ developers and traders.

Hello I am trying to create an alert on my watch list that would change the column color and ring a bell when a 3min candle closes above the 200 ema (just for the stocks im watching)

close crosses above MovAvgExponential("length" = 200)."AvgExp" from 1 bars ago
  • I want the column to turn Green when true
  • Alert (Chime) to go off
T6h72R3.png
Could you share the code to this chart? This looks very helpful.
 
Moving Average Crossover Watchlist Column for ThinkorSwim ( for spy & qqq only)
Ben,

What needs to be done in order for it to show me what happening with moving average (EMA) only for SPY & QQQ ?

Thank you!

Daniel
 
Last edited by a moderator:
Last edited:
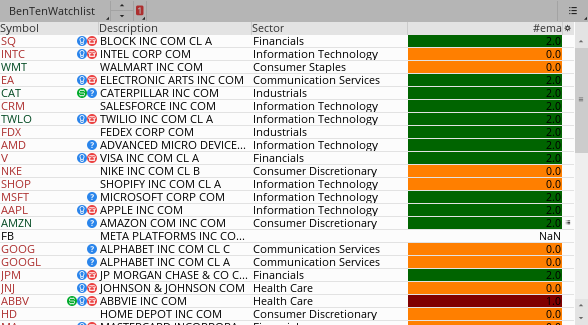
If anyone uses EMA crossover as a way to identify trend or point of entry/exit, knowing when there is a moving average crossover on your watchlist column can certainly be helpful. Here is a quick snippet that let you do just that.

It includes lookback period so that you can set to X amount of when there is an EMA (exponential moving average) crossover. For example, the default is 5. The column will turn green when there is a bullish crossover within the last 5 bars and vice versa. Orange for neutral.

DQJCTgG.png


thinkScript Code

Rich (BB code):
# WalkingBallista EMA Lookback Cross
# https://usethinkscript.com/d/119-moving-average-crossover-watchlist-column-for-thinkorswim

declare lower;

input lookback = 5;
input ema1_len = 10;
input ema2_len = 20;
input averageType = AverageType.EXPONENTIAL;

def ema1 = MovAvgExponential(length=ema1_len);
def ema2 = MovAvgExponential(length=ema2_len);

def bull_cross = ema1 crosses above ema2;
def bear_cross = ema1 crosses below ema2;

def bull_lookback = highest(bull_cross, lookback);
def bear_lookback = highest(bear_cross, lookback);

plot signal = if bull_lookback then 2 else if bear_lookback then 1 else 0;
signal.AssignValueColor(if signal == 2 then Color.Dark_Green else if signal == 1 then Color.Dark_Red else Color.Dark_Orange);
AssignBackgroundCOlor(if signal == 2 then Color.Dark_Green else if signal == 1 then Color.Dark_Red else Color.Dark_Orange);

The default values for EMAs are 10 and 20. You can change the input to whichever EMA you use on your chart.

In case you don't want to check for moving average crossover but price moving above or below a specific moving average, you can use the alternative code below.

This script will highlight the column green if the current stock price is above the 200 simple moving average. If the price is below the 200 SMA, the column will turn red.

Code:
input price = close;
input length = 200;
input displace = 0;

plot SMA = Average(price[-displace], length);
AssignBackgroundColor(if price > SMA then color.dark_green else color.dark_red);
Love what you did here with the code! Can you add a script to count the amount of bars after the 8ema crossed above the 21 and vice versa, count the opposite when 21 crosses below the 8? I think it's a nice addition to the lookback period so instead of showing green if the cross happened within the last 5 bars. It can also show the count of bars since the cross happened. Thanks!
 
Love what you did here with the code! Can you add a script to count the amount of bars after the 8ema crossed above the 21 and vice versa, count the opposite when 21 crosses below the 8? I think it's a nice addition to the lookback period so instead of showing green if the cross happened within the last 5 bars. It can also show the count of bars since the cross happened. Thanks!

You give it a try using the snippets provided in the following threads:
 
Ben, can you help me turn the following code into a watchlist label that shows the ATR % a given stock has reached for the day? I want. to see the % on my watchlist as I prefer them over charts. Thanks!

Code:
declare upper;

input AtrAvgLength = 14;

def ATR = WildersAverage(TrueRange(high(period = aggregationPeriod.DAY), close(period = aggregationPeriod.DAY), low(period = aggregationPeriod.DAY)), AtrAvgLength);

def TodayHigh = Highest(high(period = aggregationPeriod.DAY), 1);
def TodayLow = Lowest(low(period = aggregationPeriod.DAY), 1);

def DTR = TodayHigh - TodayLow;

def DTRpct = Round((DTR / ATR) * 100, 0);

AddLabel (yes, "DTR " + Round (DTR , 2) + " vs ATR " + round (ATR,2)+ "  " + round (DTRpct,0) + "%", Color.GRAY);

Did you try this? https://usethinkscript.com/threads/dtr-vs-atr-indicator-for-thinkorswim.387/
 
Is there a way to add an alert to notify me when this is triggered?
I am using this in the MarketWatch of ToS.
Thank you for the Guidance. I had to make some slight changes to the code you posted, and it works great now. I used the following code:

Code:
def EMA8 = ExpAverage(close, 8);
def EMA13 = ExpAverage(close, 13);
def EMA21 = ExpAverage(close, 21);
def EMA34 = ExpAverage(close, 34);
def EMA55 = ExpAverage(close, 55);
def EMA89 = ExpAverage(close, 89);

def bullish = EMA8 CROSSES ABOVE EMA13 and EMA13 > EMA21 and EMA21 > EMA34 and EMA34 > EMA55 and EMA55 > EMA89;
def bearish = EMA8 CROSSES BELOW EMA13 and EMA13 < EMA21 and EMA21 < EMA34 and EMA34 < EMA55 and EMA55 < EMA89;
I cant get this code to work in watchlist. I get the one plot expected error. I tried changing the def to plot didnt help. ideas? I love the idea!
 
If anyone uses EMA crossover as a way to identify trend or point of entry/exit, knowing when there is a moving average crossover on your watchlist column can certainly be helpful. Here is a quick snippet that let you do just that.

It includes lookback period so that you can set to X amount of when there is an EMA (exponential moving average) crossover. For example, the default is 5. The column will turn green when there is a bullish crossover within the last 5 bars and vice versa. Orange for neutral.

View attachment 4411

thinkScript Code

Rich (BB code):
# WalkingBallista EMA Lookback Cross
# https://usethinkscript.com/d/119-moving-average-crossover-watchlist-column-for-thinkorswim

declare lower;

input lookback = 5;
input ema1_len = 10;
input ema2_len = 20;
input averageType = AverageType.EXPONENTIAL;

def ema1 = MovAvgExponential(length=ema1_len);
def ema2 = MovAvgExponential(length=ema2_len);

def bull_cross = ema1 crosses above ema2;
def bear_cross = ema1 crosses below ema2;

def bull_lookback = highest(bull_cross, lookback);
def bear_lookback = highest(bear_cross, lookback);

plot signal = if bull_lookback then 2 else if bear_lookback then 1 else 0;
signal.AssignValueColor(if signal == 2 then Color.Dark_Green else if signal == 1 then Color.Dark_Red else Color.Dark_Orange);
AssignBackgroundCOlor(if signal == 2 then Color.Dark_Green else if signal == 1 then Color.Dark_Red else Color.Dark_Orange);

The default values for EMAs are 10 and 20. You can change the input to whichever EMA you use on your chart.

In case you don't want to check for moving average crossover but price moving above or below a specific moving average, you can use the alternative code below.

This script will highlight the column green if the current stock price is above the 200 simple moving average. If the price is below the 200 SMA, the column will turn red.

Code:
input price = close;
input length = 200;
input displace = 0;

plot SMA = Average(price[-displace], length);
AssignBackgroundColor(if price > SMA then color.dark_green else color.dark_red);

I'd like to add a column to check price moving above or below an EMA instead of SMA. Can I simply replace "SMA" with "EMA"? I wasn't sure if I had to change the settings as well.
Thanks

Code:
input price = close;
input length = 200;
input displace = 0;

plot SMA = Average(price[-displace], length);
AssignBackgroundColor(if price > SMA then color.dark_green else color.dark_red);

Change Average to ExpAverage:
input price = close;
input length = 200;
input displace = 0;

plot EMA = ExpAverage(price[-displace], length);
AssignBackgroundColor(if price > EMA then color.dark_green else color.dark_red);
 
If anyone uses EMA crossover as a way to identify trend or point of entry/exit, knowing when there is a moving average crossover on your watchlist column can certainly be helpful. Here is a quick snippet that let you do just that.

It includes lookback period so that you can set to X amount of when there is an EMA (exponential moving average) crossover. For example, the default is 5. The column will turn green when there is a bullish crossover within the last 5 bars and vice versa. Orange for neutral.

View attachment 4411

thinkScript Code

Rich (BB code):
# WalkingBallista EMA Lookback Cross
# https://usethinkscript.com/d/119-moving-average-crossover-watchlist-column-for-thinkorswim

declare lower;

input lookback = 5;
input ema1_len = 10;
input ema2_len = 20;
input averageType = AverageType.EXPONENTIAL;

def ema1 = MovAvgExponential(length=ema1_len);
def ema2 = MovAvgExponential(length=ema2_len);

def bull_cross = ema1 crosses above ema2;
def bear_cross = ema1 crosses below ema2;

def bull_lookback = highest(bull_cross, lookback);
def bear_lookback = highest(bear_cross, lookback);

plot signal = if bull_lookback then 2 else if bear_lookback then 1 else 0;
signal.AssignValueColor(if signal == 2 then Color.Dark_Green else if signal == 1 then Color.Dark_Red else Color.Dark_Orange);
AssignBackgroundCOlor(if signal == 2 then Color.Dark_Green else if signal == 1 then Color.Dark_Red else Color.Dark_Orange);

The default values for EMAs are 10 and 20. You can change the input to whichever EMA you use on your chart.

In case you don't want to check for moving average crossover but price moving above or below a specific moving average, you can use the alternative code below.

This script will highlight the column green if the current stock price is above the 200 simple moving average. If the price is below the 200 SMA, the column will turn red.

Code:
input price = close;
input length = 200;
input displace = 0;

plot SMA = Average(price[-displace], length);
AssignBackgroundColor(if price > SMA then color.dark_green else color.dark_red);
Hi Ben, Can you please provide the code that when price closes above 9EMA then green, equal then orange else is red? Thank you very much...
 
Hi Ben, Can you please provide the code that when price closes above 9EMA then green, equal then orange else is red? Thank you very much...

Sure. Here is @BenTen's script replacing the default values for EMAs of 10 and 20 with EMA of 9 and CLOSE
hhCsxy5.png

Ruby:
# WalkingBallista EMA Lookback Cross
# https://usethinkscript.com/d/119-moving-average-crossover-watchlist-column-for-thinkorswim

declare lower;

input lookback = 5;
input ema1_len = 9;
input averageType = AverageType.EXPONENTIAL;

def ema1 = MovAvgExponential(length=ema1_len);


def bull_cross = close crosses above ema1;
def bear_cross = close crosses below ema1;

def bull_lookback = highest(bull_cross, lookback);
def bear_lookback = highest(bear_cross, lookback);

plot signal = if bull_lookback then 2 else if bear_lookback then 1 else 0;
AssignBackgroundCOlor(if signal == 2 then Color.Dark_Green else if signal == 1 then Color.Dark_Red else Color.Dark_Orange);
 
Last edited:
Thank you for this contribution.

I prefer simple ma so I changed all of the ema to sma and EXPONENTIAL to SIMPLE. Can you please tell what is wrong here?

Code:
# WalkingBallista SMA Lookback Cross
# https://usethinkscript.com/d/119-moving-average-crossover-watchlist-column-for-thinkorswim

declare lower;

input lookback = 2;
input sma1_len = 5;
input sma2_len = 200;
input averageType = AverageType.SIMPLE;

def sma1 = MovAvgSIMPLE(length=sma1_len);
def sma2 = MovAvgSIMPLE(length=sma2_len);

def bull_cross = sma1 crosses above sma2;
def bear_cross = sma1 crosses below sma2;

def bull_lookback = highest(bull_cross, lookback);
def bear_lookback = highest(bear_cross, lookback);

plot signal = if bull_lookback then 2 else if bear_lookback then 1 else 0;
signal.AssignValueColor(if signal == 2 then Color.Dark_Green else if signal == 1 then Color.Dark_Red else Color.Dark_Orange);
AssignBackgroundCOlor(if signal == 2 then Color.Dark_Green else if signal == 1 then Color.Dark_Red else Color.Dark_Orange);

THANK YOU,
Doug
Change MovAvgExponential to MovingAverage, not MovAvgSIMPLE
 

Similar threads

Not the exact question you're looking for?

Start a new thread and receive assistance from our community.

87k+ Posts
288 Online
Create Post

Similar threads

Similar threads

The Market Trading Game Changer

Join 2,500+ subscribers inside the useThinkScript VIP Membership Club
  • Exclusive indicators
  • Proven strategies & setups
  • Private Discord community
  • ‘Buy The Dip’ signal alerts
  • Exclusive members-only content
  • Add-ons and resources
  • 1 full year of unlimited support

Frequently Asked Questions

What is useThinkScript?

useThinkScript is the #1 community of stock market investors using indicators and other tools to power their trading strategies. Traders of all skill levels use our forums to learn about scripting and indicators, help each other, and discover new ways to gain an edge in the markets.

How do I get started?

We get it. Our forum can be intimidating, if not overwhelming. With thousands of topics, tens of thousands of posts, our community has created an incredibly deep knowledge base for stock traders. No one can ever exhaust every resource provided on our site.

If you are new, or just looking for guidance, here are some helpful links to get you started.

What are the benefits of VIP Membership?
VIP members get exclusive access to these proven and tested premium indicators: Buy the Dip, Advanced Market Moves 2.0, Take Profit, and Volatility Trading Range. In addition, VIP members get access to over 50 VIP-only custom indicators, add-ons, and strategies, private VIP-only forums, private Discord channel to discuss trades and strategies in real-time, customer support, trade alerts, and much more. Learn all about VIP membership here.
How can I access the premium indicators?
To access the premium indicators, which are plug and play ready, sign up for VIP membership here.
Back
Top