Moving Average Crossover RSI Indicator for ThinkorSwim

BenTen

Administrative
Staff member
Staff
VIP
Lifetime
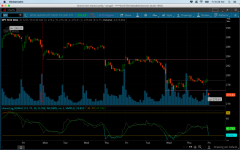
This script plot the 5 SMA (Simple Moving Average) of the RSI (Relative Strength Index) inside the default RSI indicator. Inspired by the Thandicator by Thanson Stevens on TradingView.

uCYNEmb.png


thinkScript Code

Rich (BB code):
#
# TD Ameritrade IP Company, Inc. (c) 2007-2019
# Tweaked by @korygill
# https://usethinkscript.com/d/185-moving-average-crossover-rsi-indicator-for-thinkorswim

declare lower;

input length = 14;
input over_Bought = 70;
input over_Sold = 30;
input price = close;
input averageType = AverageType.WILDERS;
input showBreakoutSignals = no;
input rsiMALength = 5; #hint rsiMALength: RSI Moving Average Length
input rsiAverageType = AverageType.SIMPLE;

def NetChgAvg = MovingAverage(averageType, price - price[1], length);
def TotChgAvg = MovingAverage(averageType, AbsValue(price - price[1]), length);
def ChgRatio = if TotChgAvg != 0 then NetChgAvg / TotChgAvg else 0;

plot RSI = 50 * (ChgRatio + 1);
plot OverSold = over_Sold;
plot OverBought = over_Bought;
plot UpSignal = if RSI crosses above OverSold then OverSold else Double.NaN;
plot DownSignal = if RSI crosses below OverBought then OverBought else Double.NaN;

# plot the RSI Moving Average
def rsiMA = MovingAverage(rsiAverageType, RSI, rsiMALength);
plot prsiMA = rsiMA;

UpSignal.SetHiding(!showBreakoutSignals);
DownSignal.SetHiding(!showBreakoutSignals);

RSI.DefineColor("OverBought", GetColor(5));
RSI.DefineColor("Normal", GetColor(7));
RSI.DefineColor("OverSold", GetColor(1));
RSI.AssignValueColor(if RSI > over_Bought then RSI.color("OverBought") else if RSI < over_Sold then RSI.color("OverSold") else RSI.color("Normal"));
OverSold.SetDefaultColor(GetColor(8));
OverBought.SetDefaultColor(GetColor(8));
UpSignal.SetDefaultColor(Color.UPTICK);
UpSignal.SetPaintingStrategy(PaintingStrategy.ARROW_UP);
DownSignal.SetDefaultColor(Color.DOWNTICK);
DownSignal.SetPaintingStrategy(PaintingStrategy.ARROW_DOWN);

Shareable Link

https://tos.mx/ldVZ7s

Credit:
 

Attachments

  • uCYNEmb.png
    uCYNEmb.png
    106 KB · Views: 237
Last edited:

Join useThinkScript to post your question to a community of 21,000+ developers and traders.

Could someone add a second RSI moving average option to this, please? thank you

Code:
#
# TD Ameritrade IP Company, Inc. (c) 2007-2019
# Tweaked by [USER=212]@korygill[/USER]
# https://usethinkscript.com/d/185-moving-average-crossover-rsi-indicator-for-thinkorswim

declare lower;

input length = 14;
input over_Bought = 70;
input over_Sold = 30;
input price = close;
input averageType = AverageType.WILDERS;
input showBreakoutSignals = no;
input rsiMALength = 5; #hint rsiMALength: RSI Moving Average Length
input rsiAverageType = AverageType.SIMPLE;

def NetChgAvg = MovingAverage(averageType, price - price[1], length);
def TotChgAvg = MovingAverage(averageType, AbsValue(price - price[1]), length);
def ChgRatio = if TotChgAvg != 0 then NetChgAvg / TotChgAvg else 0;

plot RSI = 50 * (ChgRatio + 1);
plot OverSold = over_Sold;
plot OverBought = over_Bought;
plot UpSignal = if RSI crosses above OverSold then OverSold else Double.NaN;
plot DownSignal = if RSI crosses below OverBought then OverBought else Double.NaN;

# plot the RSI Moving Average
def rsiMA = MovingAverage(rsiAverageType, RSI, rsiMALength);
plot prsiMA = rsiMA;

UpSignal.SetHiding(!showBreakoutSignals);
DownSignal.SetHiding(!showBreakoutSignals);

RSI.DefineColor("OverBought", GetColor(5));
RSI.DefineColor("Normal", GetColor(7));
RSI.DefineColor("OverSold", GetColor(1));
RSI.AssignValueColor(if RSI > over_Bought then RSI.color("OverBought") else if RSI < over_Sold then RSI.color("OverSold") else RSI.color("Normal"));
OverSold.SetDefaultColor(GetColor(8));
OverBought.SetDefaultColor(GetColor(8));
UpSignal.SetDefaultColor(Color.UPTICK);
UpSignal.SetPaintingStrategy(PaintingStrategy.ARROW_UP);
DownSignal.SetDefaultColor(Color.DOWNTICK);
DownSignal.SetPaintingStrategy(PaintingStrategy.ARROW_DOWN);
 
Last edited by a moderator:
Hi, please use the search function, there are many examples of how to do this. Thanks.
 
@markos Actually that was a rather odd request if you think about it. RSI is a bounded oscillator with values between -100 and +100. There is really no way to calculate when that would ever cross a moving average. AMZN currently has an RSI of 56 and a EMA(5) of 1789. They won't cross anytime soon
 
@tomsk yes it will. The EMA that is used in this indicator is using RSI as the input instead of close. Your example has close as an input not RSI. If you set EMA's input as RSI it will cross RSI
 
Yup @tomsk anything is possible. Until I got to this site, I had never considered slowing down that classic indicator :) JC at simplerstuff must have sold it recently 🤣
 
@korygill What I am trying to do is scan for a number of periods where the prsiMA is above or below the RSI. So in example RsiMA> RSI for 20 days.

Can someone point me in the right direction please?

Thanks in advance!

Jim
 
Last edited by a moderator:
Hello there been trying to get a scanner that can scan the crossover of 14 RSI with 50 SMA i can get results on any time frame if anyone can help would be greatly appreciated
 
I was wondering if anyone had a lower SMA indicator that won't distort when matched with RSI? When looking back at the stock it always shows the perfect sell time for me but the stock moving it becomes distorted . if not what are some good leading indicators to use for the perfect time to sell?
 
@robbydoggy You can not combine the SMA of the stock price with the RSI indicator. It will not work. An alternative to that would be taking the SMA of the RSI.
 
I tried to combine to create an indicator for when the EMA 9 crosses EMA 20 and the RSI 7 crosses above 60 as a buy signal and the sell is EMA 9 crosses below EMA 20 and RSI crosses below 40. I'm not sure where I am going wrong but it is not plotting anything. Any suggestions?

Code:
input price_ema = close;
input length_emafast = 9;
input length_emaslow = 20;
input displace = 0;

def emacondition1 =expAverage(price_ema[-displace], length_emafast) crosses above expaverage(price_ema[-displace], length_emaslow) ;
def emacondition2 =expAverage(price_ema[-displace], length_emafast) crosses below expaverage(price_ema[-displace], length_emaslow) ;

input length = 7;
input over_sold = 40;
input over_bought = 60;
input averagetype = averageType.WILDERS;

def price = close + low + high;
def rsicondition1 = averagetype > over_bought;
def rsicondtion2 = averagetype < over_sold;

plot pUp = rsicondition1 and emacondition1 ;
pUp.SetPaintingStrategy(PaintingStrategy.BOOLEAN_ARROW_UP);
pUp.SetLineWeight(1);
pUp.AssignValueColor(COLOR.CYAN);

plot pDown = rsicondtion2 and emacondition2;
pDown.SetPaintingStrategy(PaintingStrategy.BOOLEAN_ARROW_DOWN);
pDown.SetLineWeight(1);
pDown.AssignValueColor(COLOR.CYAN);
 
@Njo To be honest, I've never had any luck with backtesting any Moving Average Crossover systems... In fact, just last night I tried recreating a Forex trade system using crossovers, RSI, and Stochastic but it failed miserably... The inherent lag of the moving averages makes profitability difficult... I'll check your code... Mine is shorter because I was just confirming my roof of concept notion that it would perform just as bad as all of my previous attempts... I keep thinking that one will work but none have been profitable... I've even implemented stoploss and limits with little benefit...

Edited to add: Your code does paint down arrows... I used the TOS TEMA Study to plot the 2 EMA's and a 200 SMA... I keep getting interrupted so I may not get much further until later...
 
Last edited:

Similar threads

Not the exact question you're looking for?

Start a new thread and receive assistance from our community.

87k+ Posts
443 Online
Create Post

Similar threads

Similar threads

The Market Trading Game Changer

Join 2,500+ subscribers inside the useThinkScript VIP Membership Club
  • Exclusive indicators
  • Proven strategies & setups
  • Private Discord community
  • ‘Buy The Dip’ signal alerts
  • Exclusive members-only content
  • Add-ons and resources
  • 1 full year of unlimited support

Frequently Asked Questions

What is useThinkScript?

useThinkScript is the #1 community of stock market investors using indicators and other tools to power their trading strategies. Traders of all skill levels use our forums to learn about scripting and indicators, help each other, and discover new ways to gain an edge in the markets.

How do I get started?

We get it. Our forum can be intimidating, if not overwhelming. With thousands of topics, tens of thousands of posts, our community has created an incredibly deep knowledge base for stock traders. No one can ever exhaust every resource provided on our site.

If you are new, or just looking for guidance, here are some helpful links to get you started.

What are the benefits of VIP Membership?
VIP members get exclusive access to these proven and tested premium indicators: Buy the Dip, Advanced Market Moves 2.0, Take Profit, and Volatility Trading Range. In addition, VIP members get access to over 50 VIP-only custom indicators, add-ons, and strategies, private VIP-only forums, private Discord channel to discuss trades and strategies in real-time, customer support, trade alerts, and much more. Learn all about VIP membership here.
How can I access the premium indicators?
To access the premium indicators, which are plug and play ready, sign up for VIP membership here.
Back
Top