Mimicking "Power X Strategy" by Markus Heitkoetter

Status
Not open for further replies.
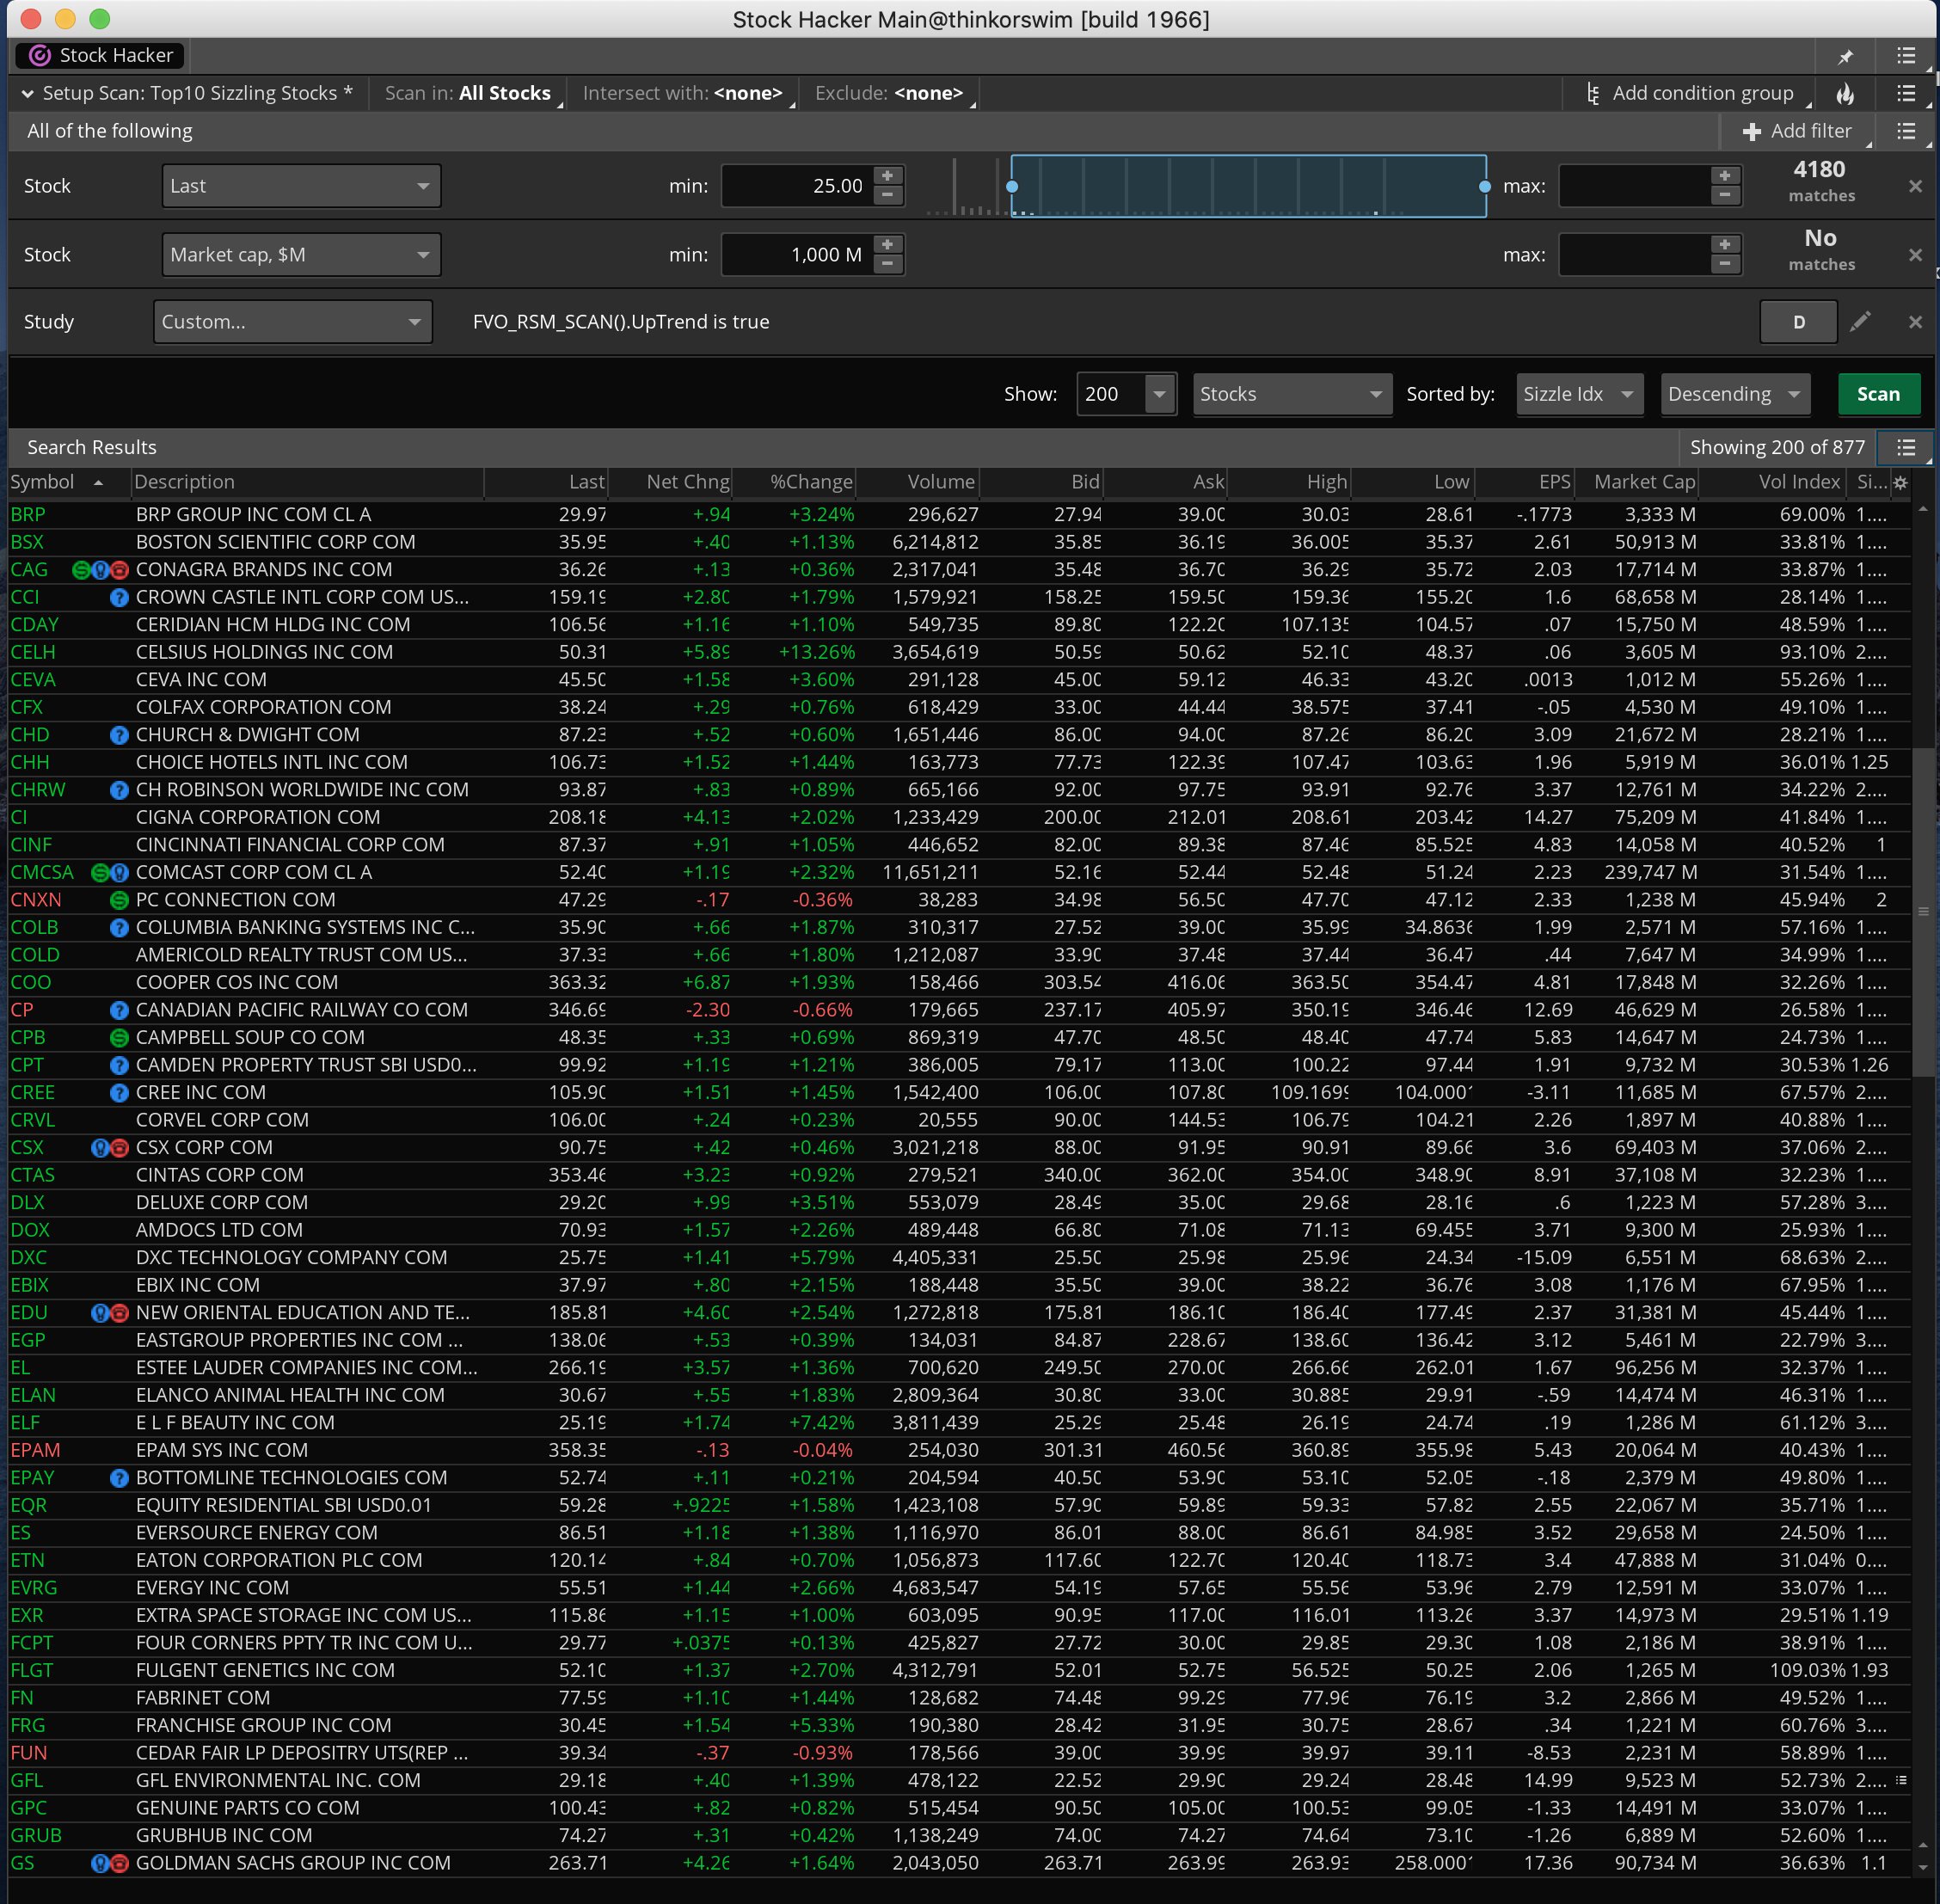
Please see the attached links below. Scan code shows that I'm scanning for tickers that have "Uptrend = True" condition on Daily and Scan results shows some of the tickers, ex: ABBV, FISV, MNST, EEM, VLO that aren't on Uptrend showing up. Both the scan and my charts are on Daily

3 out of the 5 you posted has started the uptrend. my query has no other conditions than Power-X, the way I filter stock is by pointing to S&P 500, as a matter of fact I don't even specify "is true" , I leave my query to "FVO_RSM_Scan().UpTrendJustStarted"

One suggestion I have for all here, Please leave the names of the scripts as decided by author, it kind of get's confusing and convoluted to refer to different names. One of the biggest failure of most of the open source softwares out there.

buoKsKh.png
 

Volatility Trading Range

VTR is a momentum indicator that shows if a stock is overbought or oversold based on its Weekly and Monthly average volatility trading range.

Download the indicator

So, Caught COST with Power-X on 15m today and traded it up from 377 to 381, It was already in uptrend on Daily though. @cos251
@SuryaKiranC I apologize if you are already explained. How did you catch COST - I mean ; used a scan and took entry based on any signal? Can you please give series of steps you followed before taking the trade and things considered which trigged you to close the trade....
appreciate your time and help...

based on the comment#324 are you using this grid https://tos.mx/UQ8j12s
 
@venkat the Grid is for chart, and I do have a scanner, I keep changing timeframe on scanner and scan them. Knowing whole market is down, was looking for a reversal. Got COST on a 15m scanner and when loaded up on a chart 1y 1D, it's already in progress and UpTrending, so was an easy decision to make the trade. Sure did load up the 15m chart before entering the trade, MTF version of the script showed upTrending in multiple timeframes between 15m and 1D, then there is no time to waste.

Hope this helps.

-S
 
Thanks @SuryaKiranC. I think I figured out what is happening here. Uptrend catches everything that are currently in the uptrend and for which uptrend is just beginning. So the cloud doesn't show up, but it's getting ready to show up. What other indicators do you use other than the Power-X to take a Long or Short position?
 
@cos251 no coding required, but here is another setup I am looking at, side-by-side to Power-X, thought you may be interested.

https://usethinkscript.com/threads/leavitt-slope-and-leavitt-acceleration-indicators.4989/post-47039
I saw this thread the other day. I started poking around with the Leavitt Slope to see if I could in corporate it into my overall trading signal. Nice work. I checked out the grid and found the DV Clearing Range to be very useful as well. I like the setup so far.

@SuryaKiranC @cos251 I believe this is what @andre.muhammad was referring to:

F2Wkxd0.png
Thx @BenTen
Is this freely available code or restricted to BTD? I figured I would try to put something together but also not recreate the wheel if I don't have too. Thx. :)
 
@cos251, in your screenshot of #313, how did you get the sole coincident yellow arrow (FS5x3) to align with the red/green (FS17x5) arrows in the lower study. I notice that the other yellow FS5x3 arrows which are not coincident with the red/green FS17x5 magically do not plot. Thanks for your help.
Hey @Kayben - so sorry for the delayed reply. In that script (which we cannot code for) :) - I simply set a rule to check for those arrows being true all at the same time a plotted a yellow arrow - just serves as another visual queue.
 
I've been trading this indicator for 2 days using a 15 minute chart. I'm experimenting with high volume stocks at various price ranges. Although I'm early in the process I've had 60% success if I take profit at the 1R target. Anyone else trying this yet?
 
I've been trading this indicator for 2 days using a 15 minute chart. I'm experimenting with high volume stocks at various price ranges. Although I'm early in the process I've had 60% success if I take profit at the 1R target. Anyone else trying this yet?
Which indicator? @HikingMan

Thanks @SuryaKiranC for the detailed explanation; do you mind point me to the scanner details (comment # if already explained)
 
Last edited:
@venkat check the following posts in that order.

P.S: Please look at the screenshots, where applicable.

Hope this helps.

-S
 
Last edited:
Status
Not open for further replies.

New Indicator: Buy the Dip

Check out our Buy the Dip indicator and see how it can help you find profitable swing trading ideas. Scanner, watchlist columns, and add-ons are included.

Download the indicator

Similar threads

Not the exact question you're looking for?

Start a new thread and receive assistance from our community.

87k+ Posts
397 Online
Create Post

Similar threads

Similar threads

The Market Trading Game Changer

Join 2,500+ subscribers inside the useThinkScript VIP Membership Club
  • Exclusive indicators
  • Proven strategies & setups
  • Private Discord community
  • ‘Buy The Dip’ signal alerts
  • Exclusive members-only content
  • Add-ons and resources
  • 1 full year of unlimited support

Frequently Asked Questions

What is useThinkScript?

useThinkScript is the #1 community of stock market investors using indicators and other tools to power their trading strategies. Traders of all skill levels use our forums to learn about scripting and indicators, help each other, and discover new ways to gain an edge in the markets.

How do I get started?

We get it. Our forum can be intimidating, if not overwhelming. With thousands of topics, tens of thousands of posts, our community has created an incredibly deep knowledge base for stock traders. No one can ever exhaust every resource provided on our site.

If you are new, or just looking for guidance, here are some helpful links to get you started.

What are the benefits of VIP Membership?
VIP members get exclusive access to these proven and tested premium indicators: Buy the Dip, Advanced Market Moves 2.0, Take Profit, and Volatility Trading Range. In addition, VIP members get access to over 50 VIP-only custom indicators, add-ons, and strategies, private VIP-only forums, private Discord channel to discuss trades and strategies in real-time, customer support, trade alerts, and much more. Learn all about VIP membership here.
How can I access the premium indicators?
To access the premium indicators, which are plug and play ready, sign up for VIP membership here.
Back
Top