Balance of Power Trend Indicator for ThinkorSwim

BenTen

Administrative
Staff member
Staff
VIP
Lifetime
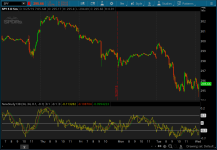
This indicator will help you determine the strength of bulls and bears. It's similar to the default Balance Of Market Power in ThinkorSwim but with additional bells and whistles.
  • Above the Zero line is bullish
  • Below the Zero line is considered bearish
BtAcMjg.png


Code:
# Balance of Power Trend
# Assembled by BenTen at useThinkScript.com
# Converted from https://www.tradingview.com/script/XldP1lmA/

declare lower;

input EMA = 34;
input TEMA = 34;
input high_l = 0.1;
input low_l = -0.1;

def THL = if(high != low, high - low, 0.01);
def BullOpen = (high - open) / THL;
def BearOpen = (open - low) / THL;
def BullClose = (close - low) / THL;
def BearClose = (high - close) / THL;
def BullOC = if(close > open, (close - open) / THL, 0);
def BearOC = if(open > close, (open - close) / THL, 0);
def BullReward = (BullOpen + BullClose + BullOC) / 3;
def BearReward = (BearOpen + BearClose + BearOC) / 3;
def BOP = BullReward - BearReward;

def SmoothBOP = expAverage(BOP, EMA);
def xPrice = SmoothBOP;
def xEMA1 = expAverage(SmoothBOP, TEMA);
def xEMA2 = expAverage(xEMA1, TEMA);
def xEMA3 = expAverage(xEMA2, TEMA);
def nRes = 3 * xEMA1 - 3 * xEMA2 + xEMA3;
def SmootherBOP = nRes;

plot h = high_l;
plot l = low_l;
plot ZeroLine = 0;

plot s1 = SmoothBOP;
plot s2 = SmootherBOP;
plot s3 = SmootherBOP[2];

ZeroLine.SetDefaultColor(GetColor(3));
h.SetDefaultColor(GetColor(3));
l.SetDefaultColor(GetColor(3));
 

Attachments

  • BtAcMjg.png
    BtAcMjg.png
    138.8 KB · Views: 275
@BenTen If it isn't possible, I think it would be very useful to have an option to plot the crossing signals on an upper chart.

Thank you.
 
@BenTen Just to clarify, when I said to make it plot as an upper study, I didn't mean the three lines (zero, -0.1, +0.1). I mean the "channel," the green/red lines and the yellow line, so it would be the S1, S2, and S3 plots.
 
@BenTen Just to clarify, when I said to make it plot as an upper study, I didn't mean the three lines (zero, -0.1, +0.1). I mean the "channel," the green/red lines and the yellow line, so it would be the S1, S2, and S3 plots.
@john3 that would be changing the intent if the indicator. It is not meant as a s/r indicator.
TDA offers free tours if you haven't had yours yet. Have 10 questions ready to ask so that you can be shown what you want to see.
 
Last edited:
dSnH9lC.png


Very nice divergence clue that the gap up was low probability! Thanks @BenTen
@markos could you please explain how you use/read this indicator? Like how the crossing over green and red line and yellow over the channel? thanks,
 

Attachments

  • dSnH9lC.png
    dSnH9lC.png
    45.1 KB · Views: 189
Last edited:
@BenTen I understand the indicator above zero bullish, below zero bearish. How to I interpret the green, red and yellow lines? I think it is telling more as they trend downwards or upwards,
 
Hi @BenTen , Found this version of the code which has a P/L. What can I do to limit the contract size to 1 and have it only calculate P/L results during the cash market open? Thanks!

Code:
# Balance of Power Trend
# Assembled by BenTen at useThinkScript.com
# Converted from https://www.tradingview.com/script/XldP1lmA/

declare lower;

input EMA = 34;
input TEMA = 34;
input high_l = 0.1;
input low_l = -0.1;

def THL = if(high != low, high - low, 0.01);
def BullOpen = (high - open) / THL;
def BearOpen = (open - low) / THL;
def BullClose = (close - low) / THL;
def BearClose = (high - close) / THL;
def BullOC = if(close > open, (close - open) / THL, 0);
def BearOC = if(open > close, (open - close) / THL, 0);
def BullReward = (BullOpen + BullClose + BullOC) / 3;
def BearReward = (BearOpen + BearClose + BearOC) / 3;
def BOP = BullReward - BearReward;

def SmoothBOP = expAverage(BOP, EMA);
def xPrice = SmoothBOP;
def xEMA1 = expAverage(SmoothBOP, TEMA);
def xEMA2 = expAverage(xEMA1, TEMA);
def xEMA3 = expAverage(xEMA2, TEMA);
def nRes = 3 * xEMA1 - 3 * xEMA2 + xEMA3;
def SmootherBOP = nRes;

plot h = high_l;
plot l = low_l;
plot ZeroLine = 0;

plot s1 = SmoothBOP;
plot s2 = SmootherBOP;
plot s3 = SmootherBOP[2];
s1.SetDefaultColor(Color.DARK_GRAY);
#s2.SetDefaultColor(Color.BLUE);
s3.SetDefaultColor(Color.YELLOW);
#s2.SetStyle(Curve.SHORT_DASH);
s3.SetStyle(Curve.FIRM);
#s2.SetLineWeight(3);
s3.SetLineWeight(3);
addCloud (s2, s3, Color.GREEN, Color.RED);

s2.SetDefaultColor(GetColor(5));
s2.SetPaintingStrategy(PaintingStrategy.HISTOGRAM);
s2.SetLineWeight(5);
s2.DefineColor("Positive and Up", Color.GREEN);
s2.DefineColor("Positive and Down", Color.DARK_GREEN);
s2.DefineColor("Negative and Down", Color.RED);
s2.DefineColor("Negative and Up", Color.DARK_RED);
s2.AssignValueColor(if s2 >= s3 then if s2 > s2[1] then s2.color("Positive and Up") else s2.color("Positive and Down") else if s2 < s2[1] then s2.color("Negative and Down") else s2.color("Negative and Up"));

ZeroLine.SetDefaultColor(GetColor(3));
h.SetDefaultColor(GetColor(3));
l.SetDefaultColor(GetColor(3));

#Vertical Lines
def short = s2 < s3 and s2[1] > s3[1];
def long = s2 > s3 and s2[1] < s3[1];

AddVerticalLine(short, close, Color.RED, Curve.SHORT_DASH);
AddVerticalLine(long, close, Color.GREEN, Curve.SHORT_DASH);

################################################################################################
input PandL_Label = Yes;

def orderDir = CompoundValue(1, if  s2 < s3 then 1 else if s2 > s3 then -1 else orderDir[1], 0);
def isOrder = orderDir crosses 0;

def orderCount = CompoundValue(1, if IsNaN(isOrder) then 0 else if isOrder then orderCount[1] + 1 else orderCount[1], 0);

def noBar = IsNaN(open[-1]);

def orderPrice = if isOrder then if noBar then close else open[-1] else orderPrice[1];
def profitLoss = if !isOrder or orderCount == 1 
then 0
else if orderDir < 0 then orderPrice[1] - orderPrice 
else if orderDir > 0 then orderPrice - orderPrice[1] else 0;
#else if orderDir > 0 then orderPrice[1] - orderPrice 
#else if orderDir < 0 then orderPrice - orderPrice[1] else 0;
#def profitLoss = if !isOrder or orderCount == 1 then 0 else orderPrice - orderPrice[1];
def profitLossSum = CompoundValue(1, if IsNaN(isOrder) then 0 else if isOrder then profitLossSum[1] + profitLoss else profitLossSum[1], 0);

def orderWinners = CompoundValue(1, if IsNaN(isOrder) then orderWinners[1] else if orderCount > 1 and profitLoss > 0 then orderWinners[1] + 1 else orderWinners[1], 0);

AddLabel(PandL_Label, orderCount + " orders (" + AsPercent(orderWinners / orderCount) + ") | P/L " + AsDollars((profitLossSum / TickSize()) * TickValue()), if profitLossSum > 0 then Color.GREEN else if profitLossSum < 0 then Color.RED else Color.GRAY);
 
Hi everyone. I am relatively new at trading and at TOS and in checking indicators, I have been needing an indicator that does not exist.. Balance of Market Power is the closest I found but I don't think the formula is right ... I came up with my own formula and I am trying to build a script modifying a little the preexisting script for this indicator that exist already in TOS. I don't know if anyone can orient me a little.
Thanks very much
 
@Tito It would be best to include the script as well.
Thanks for answering Ben.. I don't have the script. I don't know where or how to get it. I just saw this script on this trend but is a little more complex than what I am looking for.. What I think is that the formula Balance of Power = (Close price – Open price) / (High price – Low price) is not very well thought out , although the general idea is good. I want to replace it by ((closing price -low price)- (high price-closing price))/ (High price -Low price)
 
The idea would be to add the upper wick to the bearish element and to add the lower wick to the bullish so that the calculation would be more precise... Especially I would like to know this in areas of consolidation..

The regular formula...
Let me give an example
If we have a candle that has CP=4, OP=2, High=5, Low=2 then BAP=(4-2)/(5-2)=2/3
but...
If we have a candle that has CP=4, OP=2, High=4, Low=1 then BAP=(4-2)/(4-1)=2/3
So... Even though the wick is located in different extreme of the candle, the result remains the same which is somewhat misleading ..
 

Join useThinkScript to post your question to a community of 21,000+ developers and traders.

Similar threads

Not the exact question you're looking for?

Start a new thread and receive assistance from our community.

87k+ Posts
416 Online
Create Post

Similar threads

Similar threads

The Market Trading Game Changer

Join 2,500+ subscribers inside the useThinkScript VIP Membership Club
  • Exclusive indicators
  • Proven strategies & setups
  • Private Discord community
  • ‘Buy The Dip’ signal alerts
  • Exclusive members-only content
  • Add-ons and resources
  • 1 full year of unlimited support

Frequently Asked Questions

What is useThinkScript?

useThinkScript is the #1 community of stock market investors using indicators and other tools to power their trading strategies. Traders of all skill levels use our forums to learn about scripting and indicators, help each other, and discover new ways to gain an edge in the markets.

How do I get started?

We get it. Our forum can be intimidating, if not overwhelming. With thousands of topics, tens of thousands of posts, our community has created an incredibly deep knowledge base for stock traders. No one can ever exhaust every resource provided on our site.

If you are new, or just looking for guidance, here are some helpful links to get you started.

What are the benefits of VIP Membership?
VIP members get exclusive access to these proven and tested premium indicators: Buy the Dip, Advanced Market Moves 2.0, Take Profit, and Volatility Trading Range. In addition, VIP members get access to over 50 VIP-only custom indicators, add-ons, and strategies, private VIP-only forums, private Discord channel to discuss trades and strategies in real-time, customer support, trade alerts, and much more. Learn all about VIP membership here.
How can I access the premium indicators?
To access the premium indicators, which are plug and play ready, sign up for VIP membership here.
Back
Top