
Nick recently shared a new strategy in his newsletter which you can sign up for here Trade Long Term Registration. This strategy is a Mean Reversion short term trade that seems to work pretty well in longer-term choppy markets. It was developed to complement a long term trend following strategy to smooth out some of the rough points during these sideways markets which trend following strategies have a difficult time in.
2. Look for a pullback in that trend using a 2-day RSI. When that falls below 10, the stock is considered heavily oversold.
3. Rank any candidates using Rate of Change and select the top 5. (Not factored into the backtest but should be used if you are trading live)
4. Calculate the Average True Range (ATR) for the prior 10 days. Subtract this from the current low and place a LIMIT buy order at that level for tomorrow.
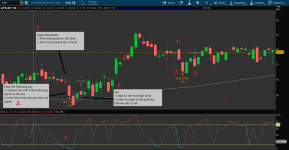
5. If the LIMIT buy level is met, then await for the first higher close.
6. Exit the position on the following open.

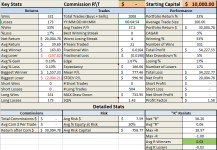
20 Years of data
100 shares per trade
10000 Starting Capital


I also wanted to see what the effect of just using the RSI Cross under 70 would do and while it did extend the trade time a little longer it introduced a lot of extra volatility into the strategy which invalidates its original purpose.

Let's dive into the strategy as Nick describes it in his newsletter.
1. Define the upward trend of the stock using a 100-day simple moving average. If the stock is above that average then it's deemed to be bullish.2. Look for a pullback in that trend using a 2-day RSI. When that falls below 10, the stock is considered heavily oversold.
3. Rank any candidates using Rate of Change and select the top 5. (Not factored into the backtest but should be used if you are trading live)
4. Calculate the Average True Range (ATR) for the prior 10 days. Subtract this from the current low and place a LIMIT buy order at that level for tomorrow.
5. If the LIMIT buy level is met, then await for the first higher close.
6. Exit the position on the following open.
Example Trade
Back Test and Parameters
20 random securities20 Years of data
100 shares per trade
10000 Starting Capital
Basic Strategy exit with Higher High Key Stats
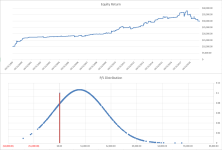
P/L and Return Distribution
I also wanted to see what the effect of just using the RSI Cross under 70 would do and while it did extend the trade time a little longer it introduced a lot of extra volatility into the strategy which invalidates its original purpose.
Share Link: https://tos.mx/j1oSLdy
Ruby:
## Mean Reversion Strategy - Nick Radge
#Coded in thinkScript by - Zach Corum
#Coded for the useThinkscript community www.usethinkscript.com

#Basic Guide
#When a stock is trending higher look for a heavily oversold point. Once an oversold level is #attained, place a buy order below the market for the following day. If that order is filled, await #the first higher close then exit the position on the next open.


input PortfolioSize = 10000;
input TradeSizePct = .05;
input TurnOnPsize = {default "Off", "On"};
input size = 100;
input MovingAverage = 100;
input ExitStrat = {default "Next Higher Close", "RSI Cross"};
input RSIl = 2;
input RSIOver = 10;
input ATRl = 10;

#Position Sizing
def pSize = PortfolioSize;
def sizeP = PortfolioSize * TradeSizePct;
def tSize = If (TurnOnPsize, sizeP / open[-1], size);

def bullbear = SimpleMovingAvg(length = MovingAverage) < close;
def pullBack = RSI(length = RSIl, "over sold" = RSIOver);
def ATR = close - ATR(ATRl);
def ATRentry = ATR >= low[-1] and ATR <= high[-1];

plot entry = pullBack < RSIOver and bullbear and ATRentry ;
plot CloseHigh = !entry[1] and close > close[1] and close > close[2];
plot movAvg = SimpleMovingAvg(length = MovingAverage);
plot exit = If (ExitStrat, pullBack crosses below RSI(2).overbought, !entry and CloseHigh);
#plot exit = RSI(length = 2, "over bought" = 70) crosses below 70;

entry.SetPaintingStrategy(paintingStrategy = PaintingStrategy.BOOLEAN_POINTS);
entry.SetLineWeight(4);
entry.SetDefaultColor(color = Color.BLUE);
Closehigh.SetPaintingStrategy(paintingStrategy = PaintingStrategy.BOOLEAN_ARROW_DOWN);
Closehigh.SetLineWeight(4);
Closehigh.SetDefaultColor(color = Color.LIME);

AddOrder(OrderType.BUY_TO_OPEN, entry and bullbear, ATR, tSize, tickcolor = Color.DARK_ORANGE, arrowcolor = Color.DARK_ORANGE);
AddOrder(type = OrderType.SELL_TO_CLOSE, exit, tickcolor = Color.GRAY, arrowcolor = Color.GRAY, name = "LongEX");
Attachments

Last edited: