@Billions good idea, I don't think it has to be difficult, I think if we all observe the relationships of the states, across the timeframes, and how the states change over the course of days, it can yield a good time and entry bias.
so to get started, something like this:
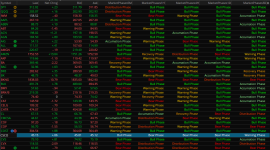
when the phases start to cycle across the time frames, go to a lower time frame like the 5 min, 1 hour for entry. usually you can see the effects of the phases changing as you up the timeframe.
in this example, cycling for a weekly swing trade, with the 5M (for entry), 1 Hour, 4 Hour, 1 Day and a 3 Day.
In the example of CSCO, I would expect a recovery phase soon in the lower time frames, setting it self up for a potential reversal/trade back to the mean/long, without looking at the chart.
Welcome any other thoughts, ideas and other columns to complement.


")