Market Phases Indicator for ThinkorSwim

Your post did not provide enough information as to why Market Phases is not working on your tick charts.
If you have a charting error, you will find an (!) explanation mark in the upper left-hand corner of your chart.
Clicking on the (!) explanation mark will provide you clues as to where you have gone astray.
yrOuPxN.png

Okay, gotcha. The exclamation says "Secondary period '512' not valid. Use one of the AggregationPeriod constants. See the thinkScript reference for the list of available constants"

I'm guessing its not able to read 512 ticks as ticks aren't on the reference list? So no for tick charts...
 
Anyway anyone can provide the code to show these labels on my charts without having it be 1MIN?
On the TOS platform, you can display data from a higher timeframe onto a lower timeframe but not the other way around.

This means if you put this indicator on a 5min chart, the lowest timeframe that will display is 5min.
If you want to display the 1min label; it must be on a 1min chart.

read more:
https://tlc.thinkorswim.com/center/...hapter-11---Referencing-Secondary-Aggregation
 
Thanks for sharing. Here is the updated code that unplot the phases by default.

Code:
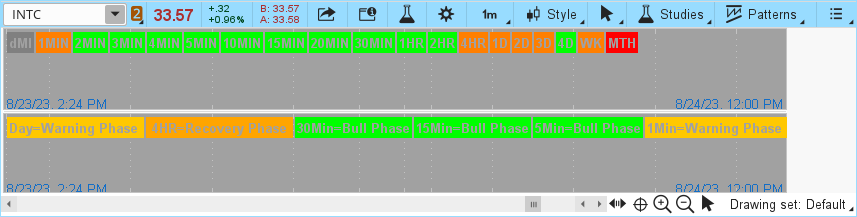
#Trend Advisor Market Phases;

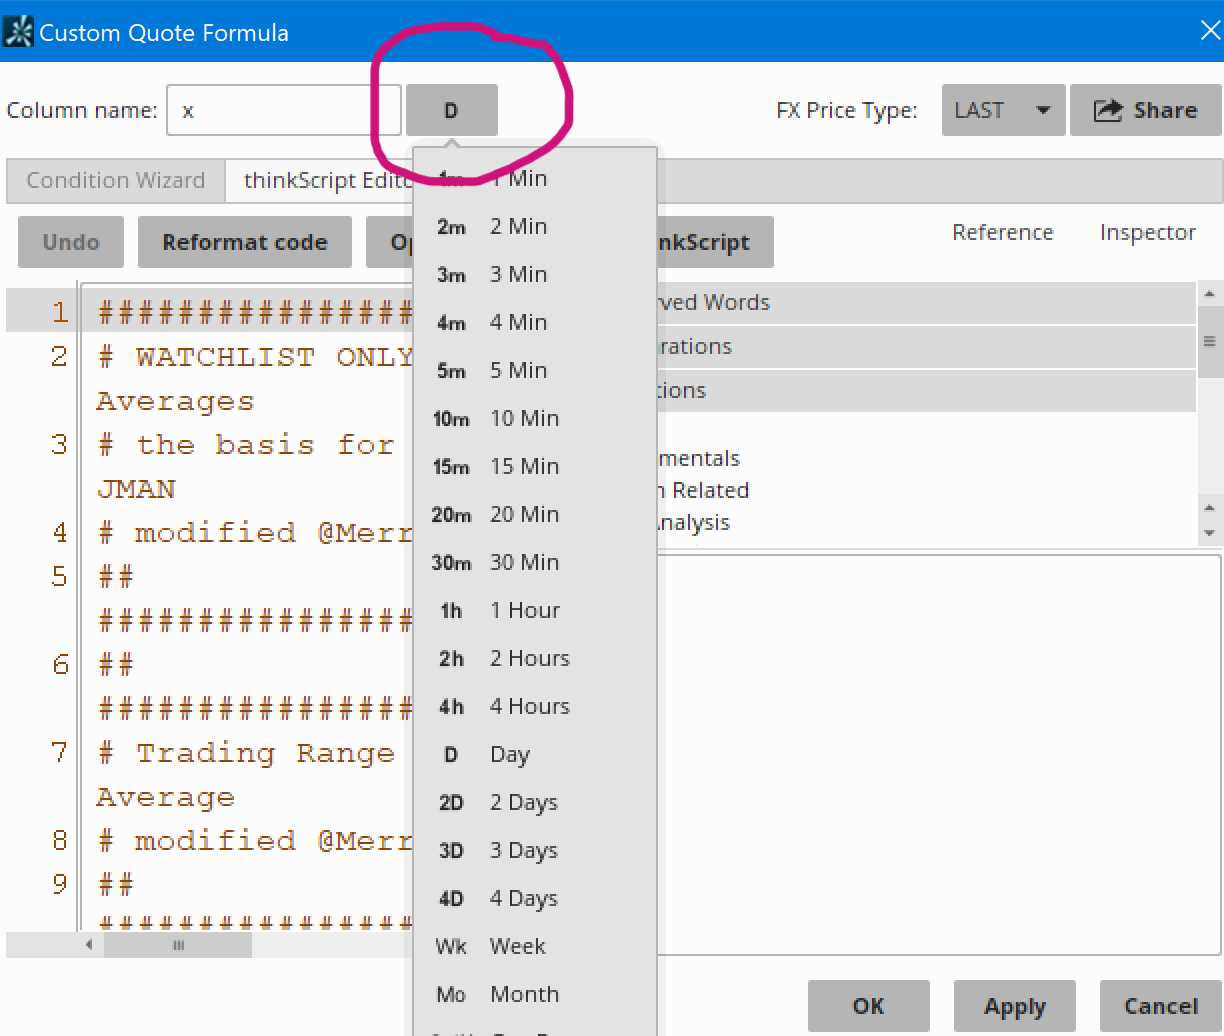
#Credit to the Chuck Dukas for creating the system and for then author of the VolumeTrendLabels whose study was use to create this indicator. Ensure you set the correct aggregation period to then chart, this helps calculate the correct volume and price action.

def agg = getAggregationPeriod();
input vPeriod = AggregationPeriod.HOUR; #hint vPeriod: Enter the chart time you use here. Required to properly caluclate volume and price strength.

def O = open(period = vPeriod);
def H = high(period = vPeriod);
def C = close(period = vPeriod);
def L = low(period = vPeriod);
def V = volume(period = vPeriod);

def SV = V * (H - C) / (H - L);
def BV = V * (C - L) / (H - L);

# below determines if volume supports the move, adds conviction

AddLabel(yes, "Buyer Vol Strong ", if high > high[1] and low > low[1] and BV*1.05 > SV then Color.GREEN else color.black);

AddLabel(yes, "Seller Vol Strong", if high < high[1] and low < low[1] and SV*1.05 > BV then Color.MAGENTA else color.black);

# below determines if price supports the move

AddLabel(yes, "Price Strong ", if high > high[1] and high [1] > high[2] and low > low[1] and low[1] > low[2] then Color.GREEN else color.black);

AddLabel(yes, "Price Weak", if high < high[1] and high[1] < high[2] and low < low[1] and low[1] < low[2] then Color.MAGENTA else color.black);

declare upper;
input price = close;
input displace = 0;

input avglength = 10; #hint avgLength: Then exponential average length you want to use for your pullback entries.

def fastavg = 50;
def slowavg = 200;


plot fastsma = Average( price, fastavg);
fastsma.SetDefaultColor(Color.Green);

plot slowsma = Average(price, slowavg);
slowsma.SetDefaultColor(Color.Red);

# Bullish criteria define below

# Define criteria for Bullish Phase : close > 50 SMA, close > 200 SMA, 50 SMA > 200 SMA

def bullphase = fastsma > slowsma && price > fastsma && price > slowsma;

# Define criteria for Accumulation Phase : close > 50 SMA, close > 200 SMA, 50 SMA < 200 SMA

def accphase = fastsma < slowsma && price > fastsma && price > slowsma;

# Define criteria for Recovery Phase : close > 50 SMA, close < 200 SMA, 50 SMA < 200 SMA

def recphase = fastsma < slowsma && price < slowsma && price > fastsma;


# Bearish Criteria define below

# Define criteria for Bearish Phase : close < 50 SMA, close < 200 SMA, 50 SMA < 200 SMA

def bearphase = fastsma < slowsma && price < fastsma && price < slowsma;

# Define criteria for Distribution Phase : close < 50 SMA, close < 200 SMA, 50 SMA > 200 SMA

def distphase = fastsma > slowsma && price < fastsma && price < slowsma;

# Define criteria for Warning Phase : close < 50 SMA, close > 200 SMA, 50 SMA > 200 SMA

def warnphase = fastsma > slowsma && price > slowsma && price < fastsma;


# Below conditions are for a possible entry when price touches the fastema

#def pbavg = MovingAverage(Average, price, avglength);

def pbavg = ExpAverage(data = price[-displace], length = avglength);

input bullpullback = yes;  #hint bullpullback: Do you want to display the pullback arrows for bullish fast ema entries.
input bearpullback = yes; #hint bearpullback: Do you want to display the pullback arrows for bearish fast ema entries.

def bullishpb = low < pbavg && open > pbavg;
def bearishpb = high > pbavg && open < pbavg;

def bullpb = bullphase is true && bullishpb is true;
def bearpb = bearphase is true && bearishpb is true;

# Plot Signals
plot bullpb1 = if bullpullback then bullpb else 0;
bullpb1.SetPaintingStrategy(PaintingStrategy.BOOLEAN_ARROW_UP);
bullpb1.SetDefaultColor(Color.CYAN);
bullpb1.SetLineWeight(1);

plot bearpb1 = if bearpullback then bearpb else 0;
bearpb1.SetPaintingStrategy(PaintingStrategy.BOOLEAN_ARROW_DOWN);
bearpb1.SetDefaultColor(Color.red);
bearpb1.SetLineWeight(1);


#plot buphase = bullphase is true;
#plot acphase = accphase is true;
#plot rephase = recphase is true;

#plot bephase = bearphase is true;
#plot dphase = distphase is true;
#plot wphase = warnphase is true;


# Below adds labels to the chart to identify what phase the underlying is in


AddLabel(bullphase, " Bull Phase" , if bullphase is true then Color.GREEN else Color.BLACK);

AddLabel(accphase, " Accumation Phase ", if accphase is true then Color.lIGHT_GREEN else Color.BLACK);

AddLabel(recphase, " Recovery Phase ", if recphase is true then Color.lIGHT_ORANGE else Color.BLACK);

AddLabel(warnphase, " Warning Phase ", if warnphase is true then Color.orANGE else Color.BLACK);

AddLabel(distphase, " Distribution Phase ", if distphase is true then Color.light_red else Color.BLACK);

AddLabel(bearphase, " Bear Phase ", if bearphase is true then Color.red else Color.BLACK);


assignPriceColor(if bullphase then Color.GREEN else if bearphase then Color.RED else Color.orange);
Hello sir,
Thanks for all you do. I'm kinda new and have zero coding experience. Anyway, is there any way to add a 6H time frame to this? TIA!
 
Thank you so much for this code. I'm attempting to create an alert based on this code in thinkorswim that will alert me when the market phase indicator goes from bullish phase to recover phase (green to yellow). How can I go about doing this? I appreciate your help.
Screen Shot 2023-07-13 at 10.27.59 AM.png
 
Last edited by a moderator:
Thank you so much for this code. I'm attempting to create an alert based on this code in thinkorswim that will alert me when the market phase indicator goes from bullish phase to recover phase (green to yellow). How can I go about doing this? I appreciate your help.
View attachment 19138
Add to the bottom of your script:
# Alert
Alert(bullphase[1] and recphase, "recover", Alert.Bar, Sound.Chimes);
 
how could be refine to work on 5m, 15m timeframe?

Bad news:
Your script is referencing the 1min timeframe.
1min timeframe nor any other lower timeframe can plot on upper timeframes.
Therefore no, your script, cannot plot on the 5min or 15min timeframe.

Good news:
See how this VIP indicator: https://usethinkscript.com/threads/...e-is-most-favorable-to-trade-using-dmi.10438/
provides similar information in a more concise format?
Aki3UrL.png

The VIP indicator will work on any timeframe. BUT BUT BUT do you REALLY want to?
If you put it on a 5min chart; LOOK at what you will miss!
The 1min timeframe just turned ugly. The trend could be ending.
But you will never get the warning! Because your labels will only display your current aggregation and higher.

This is because the 1min, 2min, 3min, 4min will NOT print on your 5min chart BECAUSE lower aggregations can NEVER plot on higher. You will miss these crucial warning signs!

Instead, read through the VIP thread for how to pin a miniature 1min-chart which will allow you to display ALL these important labels above any aggregation chart that you are using.
 
Last edited:
Can someone edit the code so that price strong or price weak are scannable condiitons? Please

Sure. Stuff one of these into your Scan Hacker:
high > high[1] and high [1] > high[2] and low > low[1] and low[1] > low[2] #price strong
or
high < high[1] and high[1] < high[2] and low < low[1] and low[1] < low[2] #price weak
 
Last edited:
Sure. Just load the watchlist from the bottom of the 1st post and set the timeframe for anything you want.
zOtGcuv.png
Also - do you know how I can EXCLUDE a phase like Bearish and recovery? I know how to select which 1 phase I want, but not "Bullish or Warning or accumulation"
 
Also - do you know how I can EXCLUDE a phase like Bearish and recovery? I know how to select which 1 phase I want, but not "Bullish or Warning or accumulation"
You can change the 'words' to whatever you want.
Yes you can comment out whichever ones you don't want.
Just put a hashtag in front of it:

For instance, to exclude recovery
change:
AddLabel(recphase, " Recovery Phase ", if recphase is true then Color.lIGHT_ORANGE else Color.BLACK);
to:
#AddLabel(recphase, " Recovery Phase ", if recphase is true then Color.lIGHT_ORANGE else Color.BLACK);
 

Join useThinkScript to post your question to a community of 21,000+ developers and traders.

Similar threads

Not the exact question you're looking for?

Start a new thread and receive assistance from our community.

87k+ Posts
565 Online
Create Post

Similar threads

Similar threads

The Market Trading Game Changer

Join 2,500+ subscribers inside the useThinkScript VIP Membership Club
  • Exclusive indicators
  • Proven strategies & setups
  • Private Discord community
  • ‘Buy The Dip’ signal alerts
  • Exclusive members-only content
  • Add-ons and resources
  • 1 full year of unlimited support

Frequently Asked Questions

What is useThinkScript?

useThinkScript is the #1 community of stock market investors using indicators and other tools to power their trading strategies. Traders of all skill levels use our forums to learn about scripting and indicators, help each other, and discover new ways to gain an edge in the markets.

How do I get started?

We get it. Our forum can be intimidating, if not overwhelming. With thousands of topics, tens of thousands of posts, our community has created an incredibly deep knowledge base for stock traders. No one can ever exhaust every resource provided on our site.

If you are new, or just looking for guidance, here are some helpful links to get you started.

What are the benefits of VIP Membership?
VIP members get exclusive access to these proven and tested premium indicators: Buy the Dip, Advanced Market Moves 2.0, Take Profit, and Volatility Trading Range. In addition, VIP members get access to over 50 VIP-only custom indicators, add-ons, and strategies, private VIP-only forums, private Discord channel to discuss trades and strategies in real-time, customer support, trade alerts, and much more. Learn all about VIP membership here.
How can I access the premium indicators?
To access the premium indicators, which are plug and play ready, sign up for VIP membership here.
Back
Top