Mannarino Market Risk Indicator (MMRI) For ThinkOrSwim

Svanoy

Expert
VIP
Lifetime
Code:
declare lower;

input symbol1 = "$dxy";
input symbol2 = "TNX";

def price1 = If !IsNaN(close(Symbol1)) then close(Symbol1) else price1[1];
def price2 = If !IsNaN(close(Symbol2)) then close(Symbol2) else price2[1];
def MMR = Round(((Price1 * (Price2/10))/1.6),2);

AddLabel(yes,"MMRI: "+MMR,if (IsNaN(MMR) or MMR<50) then color.BLACK
        else if (MMR>=50 and MMR<=100) then color.GREEN
        else if (MMR>=101 and MMR<=200) then color.YELLOW
        else if (MMR>-201 and MMR<=300) then color.ORANGE
        else color.RED);
 
I don't know why understanding TOS code is so difficult for me. This seems pretty simple to do, but I don't seem to be able to do it.
I want to create a LABEL the uses this formula: $DXY * TNX / 1.61
(It's the Gregory Mannarino market risk indicator, and I would like to see it as a label on my chart.)
You can find it here: https://traderschoice.net/about-traders-choice/

It seems so easy until I try to do it.

Thank you for the help.

See if this helps

Ruby:
def MannarinoRiskFactor = (close("$DXY") * close("TNX") / 10 / 1.61);
AddLabel(1, "MannarinoRiskFactor " + (if MannarinoRiskFactor < 100 then "[Low]: " else if Between(MannarinoRiskFactor, 100, 200) then "[Moderate]: " else if Between(MannarinoRiskFactor, 200, 300) then "[High]: " else "[Extreme]: ") + Round(MannarinoRiskFactor), if MannarinoRiskFactor < 100 then Color.DARK_GREEN else if Between(MannarinoRiskFactor, 100, 200) then Color.YELLOW else if Between(MannarinoRiskFactor, 200, 300) then Color.ORANGE else Color.RED );
 
What's behind the constant, 1.61? Maybe the Fib 1.618?

Found out some more:


GAUGING MARKET RISK BY USING A SIMPLE FORMULA INVOLVING THE 10 YEAR YIELD, AND THE DXY/DOLLAR INDEX.

I have come up with an easy way to measure market risk. THE MANNARINO MARKET RISK INDICATOR, MMRI.
Here is how the equation works. If you take the 10yr yield and multiply that by the DXY, then divide that by 1.61 (which is derived from another equation) you get X. The higher X is, the more we need to pay attention to what is going on and adjust our exposure to the stock market in terms of risk.. As examples. Right now this X is roughly in the 80's. This is a low number and represents a low risk for stocks. At the 1987 stock market crash, this number was 488, and at the 08’ meltdown it was nearly 200. The Dot-Com bubble/crash this number was 360 As a general rule, the higher the X in this calculation, the more risk averse we need to be. The MMRI, Mannarino Market Risk Indicator is based on a scale from 50-400.
Here is a general scale of how to gauge risk.
A reading from 50-100 = LOW RISK
A reading from 100-200 = MODERATE RISK
A reading above 200 = HIGH RISK
A reading above 300 = EXTREME RISK.

Gregory Mannarino

And this:
Using the Mannarino Market Risk Indicator (MMRI) to Gauge Risk in the Stock Market
November 14th, 2021


The Mannarino Market Risk Indicator (MMRI) was developed by derivatives and options trader Gregory Mannarino, to gauge risk in the United States stock markets.
The formula to calculate the MMRI is:
MMRI = (US Dollar Index DXY * 10-year US Treasury Bond Yield) / 1.61
How to Interpret the MMRI?
The MMRI indicator is interpreted based on a scale ranging from 50 to 400.
50 to 100 = Low Risk
100 to 200 = Moderate Risk
200 to 300 = High Risk
Greater than 300 = Extreme Risk


Mannarino Market Risk Indicator (MMRI) Values During Significant United States Stock Market Crashes 1987 to 2008*
1987 Stock Market Crash “Black Monday”488
2000 Stock Market Crash “Dot-Com Bubble Burst”360
2008 Stock Market Crash “Global Financial Crisis”200
Data Source: Mannarino Market Risk Indicator. Gregory Mannarino. https://steemit.com/bitcoin/@marketreport/mannarino-market-risk-indicator-by-gregory-mannarino
 
Last edited by a moderator:
I hope you are not asking ME what is behind the constant. I don't have a clue!
And that's why I am so thankful you guys around. Blessings to you.
 
gI6I2x1.png

Author Message
i was unable to find an accurate enough indicator for debt to gdp ratio. the Fred indicator understates the number. so when you want the current mmmri, you have to manually change the number for the Debt to gdp ratio in the settings of the indicator,(the multiplier).

CODE:
CSS:
#/ This source code is subject to the terms of the Mozilla Public License 2.0 at https://mozilla.org/MPL/2.0/
#// © HARRYDAN2
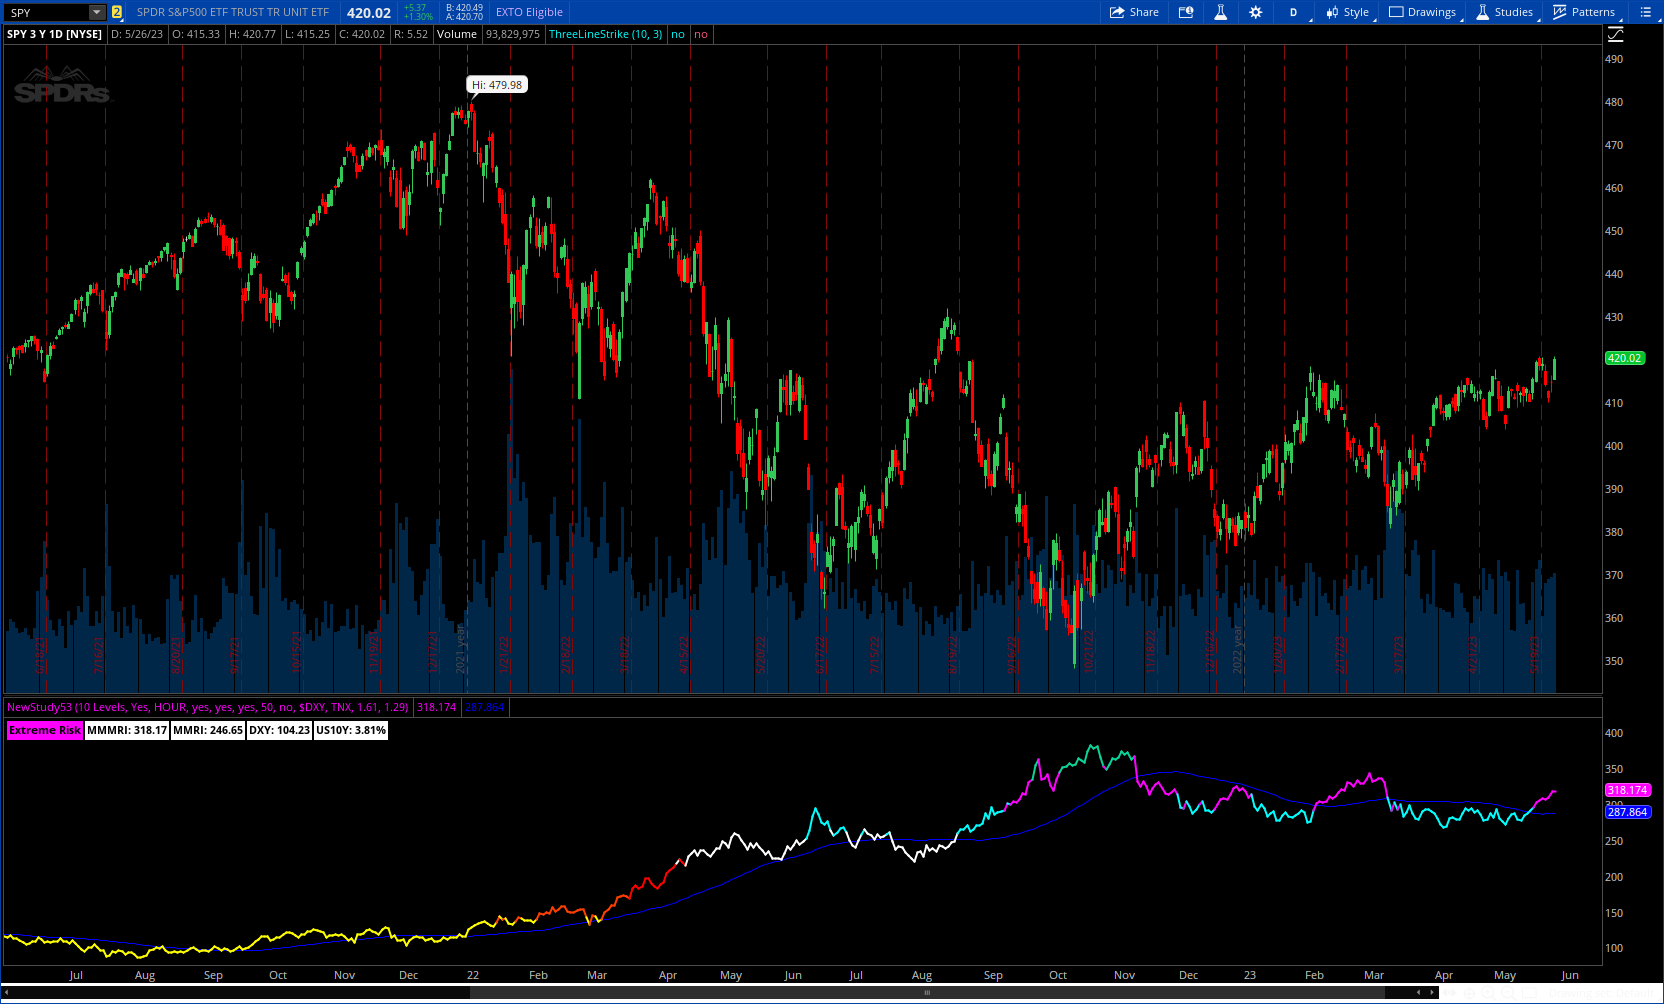
#indicator(title='Modified Mannarino Market Risk Indicator', shorttitle='MMMRI', overlay=false, scale=scale.right, format=format.price)
# Converted and mod by Sam4Cok@Samer800    - 05/2023
declare lower;
input LevelType    = {Default "10 Levels", "5 Levels"};
input useChartTimeframe = {Default "Yes", "No"};
input ManualTimeframe = AggregationPeriod.FIFTEEN_MIN;
input ShowAlertLabel = yes;
input showDetailedLabel = yes;
input useModifiedMmri = yes;
input maLength = 50;               # "SMA Length"
input hideSma = no;                # "Hide SMA"
input dollarSymbol = "$DXY";       # 'Dollar Symbol'
input yieldSymbol = "TNX";         # 'Yield Symbol'
input mmriConstant = 1.61;         # 'Divisor'
input debtGdpConstant = 1.29;     # 'Multiplier'

def lowRisk = 80;            # 'Low Risk'
def moderateRisk = 140;      # 'Moderate Risk'
def highRisk = 180;          # 'High Risk'
def extremeRisk = 220;       # 'Extreme Risk'
def tardMode = 260;          # 'Tard Mode'
def somethingsAwry = 300;    # 'Somethings Awry'
def buyPuts = 350;           # 'Buy Puts or Calls, RIsk is a Double Edged Sword'
def getStock = 400;          # 'Request Stock Certificate'
def systemError = 500;       # 'System Error Imminent'

def na = Double.NaN;
def theme = LevelType==LevelType."10 Levels";
def current = GetAggregationPeriod();
def isintraday = current < AggregationPeriod.DAY;
def RTH  = if isintraday then SecondsTillTime(0830) < 0 and SEcondsTillTime(1500) > 0 else 1;
def RTH1 = if isintraday then SecondsTillTime(0830) < 0 and SEcondsTillTime(1600) > 0 else 1;
def dollarClose; def yieldClose;
switch (useChartTimeframe) {
 case "Yes" :
    dollarClose = close(Symbol = dollarSymbol);
    yieldClose  = close(Symbol = yieldSymbol);
 case "No" :
    dollarClose = close(Symbol = dollarSymbol, Period = ManualTimeframe);
    yieldClose  = close(Symbol = yieldSymbol,  Period = ManualTimeframe);
}

def dxy   = if RTH then dollarClose else dxy[1];
def yield = if RTH then yieldClose/10 else yield[1];
def mri  = if RTH then ((dxy * yield)/(mmriConstant)) else mri[1];
def mmri = if RTH then ((dxy * yield)/(mmriConstant)) * (debtgdpConstant) else mmri[1];
def mmmri = if useModifiedMmri then mmri else mri;
def sma   = if RTH then SimpleMovingAvg(mmmri, maLength) else sma[1];

def col1 =
     if mmmri <  050                 then 1 else
     if mmmri >= 050 and mmmri < 100 then 2 else
     if mmmri >= 100 and mmmri < 200 then 3 else
     if mmmri >= 200 and mmmri < 300 then 4 else 0;

def col =
    if mmmri > lowRisk and mmmri < moderateRisk then 1 else
    if mmmri >= moderateRisk and mmmri < highRisk then 2 else
    if mmmri >= highRisk and mmmri < extremeRisk then 3 else
    if mmmri >= extremeRisk and mmmri < tardMode then 4 else
    if mmmri >= tardMode and mmmri < somethingsawry then 5 else
    if mmmri >= somethingsawry and mmmri < buyputs then 6 else
    if mmmri >= buyputs and mmmri < getstock then 7 else
    if mmmri >= getstock and mmmri < systemerror then 8 else
    if mmmri > systemerror then 9 else 0;

def riskLevel =
    if mmmri > lowRisk and mmmri < moderateRisk then 1 else
    if mmmri >= moderateRisk and mmmri < highRisk then 2 else
    if mmmri >= highRisk then 3 else
    if mmmri >= extremeRisk then 4 else
    if mmmri >= tardMode then 5 else
    if mmmri >= somethingsawry then 6 else
    if mmmri >= buyputs then 7 else
    if mmmri >= getstock then 8 else 0;

plot MMRIline = if RTH1 then mmmri else na;#, title="MMRI", trackprice=false, color=highlight(mmmri))
plot SMAline = if hideSma or !RTH1 then na else sma;#(mmmri, maLength), title="SMA", color=color.new(color.blue, 50))
MMRIline.SetLineWeight(2);
MMRIline.AssignValueColor(if theme then
                          if col==1 then Color.YELLOW else
                          if col==2 then Color.LIGHT_RED else
                          if col==3 then Color.RED else
                          if col==4 then Color.WHITE else
                          if col==5 then Color.CYAN else
                          if col==6 then Color.MAGENTA else
                          if col==7 then CreateColor(12, 211, 151) else
                          if col==8 then CreateColor(95, 50, 255) else
                          if col==9 then CreateColor(255, 109, 52) else Color.GREEN else
                          if col1==1 then Color.CYAN else
                          if col1==2 then Color.GREEN else
                          if col1==3 then Color.GRAY else
                          if col1==4 then Color.DARK_ORANGE else Color.RED);
SMAline.SetDefaultColor(Color.BLUE);

AddLabel(ShowAlertLabel, if theme then
            if riskLevel==1 then "Moderate Risk" else
            if riskLevel==2 then "High Risk" else
            if riskLevel==3 then "Extreme Risk" else
            if riskLevel==4 then "Tard Mode" else
            if riskLevel==5 then "Somethings Awry" else
            if riskLevel==6 then "Buy Puts or Calls, RIsk is a Double Edged Sword" else
            if riskLevel==7 then "Request Stock Certificate" else
            if riskLevel==8 then "System Error Imminent" else "Low Risk" else
            if col1==1 then "Slight Risk" else
            if col1==2 then "Low Risk" else
            if col1==3 then "Moderate Risk" else
            if col1==4 then "High Risk" else "Extreme Risk" ,
            if theme then
            if col==1 then Color.YELLOW else
            if col==2 then Color.LIGHT_RED else
            if col==3 then Color.RED else
            if col==4 then Color.WHITE else
            if col==5 then Color.CYAN else
            if col==6 then Color.MAGENTA else
            if col==7 then CreateColor(12, 211, 151) else
            if col==8 then CreateColor(95, 50, 255) else
            if col==9 then CreateColor(255, 109, 52) else Color.GREEN else
            if col1==1 then Color.CYAN else
            if col1==2 then Color.GREEN else
            if col1==3 then Color.GRAY else
            if col1==4 then Color.DARK_ORANGE else Color.RED);


AddLabel(showDetailedLabel, "MMMRI: " + ROUND(mmri, 2), color.WHITE);
AddLabel(showDetailedLabel, "MMRI: " + ROUND(mri, 2), color.WHITE);
AddLabel(showDetailedLabel, "DXY: " + ROUND(dxy, 2), color.WHITE);
AddLabel(showDetailedLabel, "US10Y: " + ROUND(yield, 2) + "%", color.WHITE);

#-- END CODE
 
Last edited by a moderator:

Join useThinkScript to post your question to a community of 21,000+ developers and traders.

Similar threads

Not the exact question you're looking for?

Start a new thread and receive assistance from our community.

87k+ Posts
415 Online
Create Post

Similar threads

Similar threads

The Market Trading Game Changer

Join 2,500+ subscribers inside the useThinkScript VIP Membership Club
  • Exclusive indicators
  • Proven strategies & setups
  • Private Discord community
  • ‘Buy The Dip’ signal alerts
  • Exclusive members-only content
  • Add-ons and resources
  • 1 full year of unlimited support

Frequently Asked Questions

What is useThinkScript?

useThinkScript is the #1 community of stock market investors using indicators and other tools to power their trading strategies. Traders of all skill levels use our forums to learn about scripting and indicators, help each other, and discover new ways to gain an edge in the markets.

How do I get started?

We get it. Our forum can be intimidating, if not overwhelming. With thousands of topics, tens of thousands of posts, our community has created an incredibly deep knowledge base for stock traders. No one can ever exhaust every resource provided on our site.

If you are new, or just looking for guidance, here are some helpful links to get you started.

What are the benefits of VIP Membership?
VIP members get exclusive access to these proven and tested premium indicators: Buy the Dip, Advanced Market Moves 2.0, Take Profit, and Volatility Trading Range. In addition, VIP members get access to over 50 VIP-only custom indicators, add-ons, and strategies, private VIP-only forums, private Discord channel to discuss trades and strategies in real-time, customer support, trade alerts, and much more. Learn all about VIP membership here.
How can I access the premium indicators?
To access the premium indicators, which are plug and play ready, sign up for VIP membership here.
Back
Top