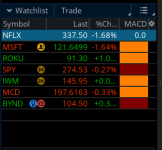
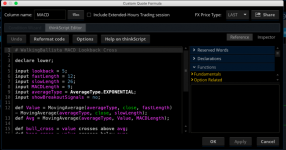
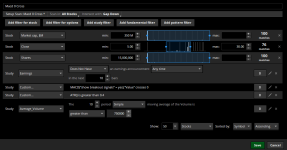
This indicator will scan for stocks with bearish and bullish MACD crossover on your watchlist and display it via a column. By default, it will look for crossover within the last 5 bars. You can change the lookback period to your liking in the code below. It works on all timeframe. Be sure to select the timeframe you want when adding the script.
Notes:


Credit:
Notes:
- Orange = Neutral. No crossover within the last X bars
- Red = Bearish crossover within the last X bars
- Green = Bullish crossover on MACD within the last X bars
thinkScript Code
Rich (BB code):
# WalkingBallista MACD Lookback Cross
# https://usethinkscript.com/d/191-macd-bullish-bearish-crossover-watchlist-column-for-thinkorswim

declare lower;

input lookback = 5;
input fastLength = 12;
input slowLength = 26;
input MACDLength = 9;
input averageType = AverageType.EXPONENTIAL;
input showBreakoutSignals = no;

def Value = MovingAverage(averageType, close, fastLength) - MovingAverage(averageType, close, slowLength);
def Avg = MovingAverage(averageType, Value, MACDLength);

def bull_cross = value crosses above avg;
def bear_cross = value crosses below avg;

def bull_lookback = highest(bull_cross, lookback);
def bear_lookback = highest(bear_cross, lookback);

plot signal = if bull_lookback then 2 else if bear_lookback then 1 else 0;
signal.AssignValueColor(if signal == 2 then Color.Dark_Green else if signal == 1 then Color.Dark_Red else Color.Dark_Orange);
AssignBackgroundCOlor(if signal == 2 then Color.Dark_Green else if signal == 1 then Color.Dark_Red else Color.Dark_Orange);
Shareable Link
https://tos.mx/pFX3vhCredit:
Attachments
Last edited:


