MACD Format, Triggers, Scan, Label, Watchlist For ThinkOrSwim

BenTen

Administrative
Staff member
Staff
VIP
Lifetime
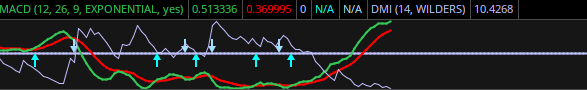
This indicator will scan for stocks with bearish and bullish MACD crossover on your watchlist and display it via a column. By default, it will look for crossover within the last 5 bars. You can change the lookback period to your liking in the code below. It works on all timeframe. Be sure to select the timeframe you want when adding the script.

Notes:
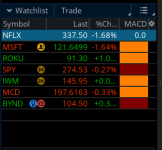
  • Orange = Neutral. No crossover within the last X bars
  • Red = Bearish crossover within the last X bars
  • Green = Bullish crossover on MACD within the last X bars
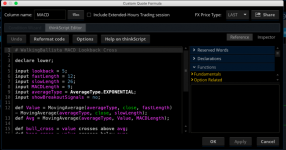
fsstyZX.png


thinkScript Code

Rich (BB code):
# WalkingBallista MACD Lookback Cross
# https://usethinkscript.com/d/191-macd-bullish-bearish-crossover-watchlist-column-for-thinkorswim

declare lower;

input lookback = 5;
input fastLength = 12;
input slowLength = 26;
input MACDLength = 9;
input averageType = AverageType.EXPONENTIAL;
input showBreakoutSignals = no;

def Value = MovingAverage(averageType, close, fastLength) - MovingAverage(averageType, close, slowLength);
def Avg = MovingAverage(averageType, Value, MACDLength);

def bull_cross = value crosses above avg;
def bear_cross = value crosses below avg;

def bull_lookback = highest(bull_cross, lookback);
def bear_lookback = highest(bear_cross, lookback);

plot signal = if bull_lookback then 2 else if bear_lookback then 1 else 0;
signal.AssignValueColor(if signal == 2 then Color.Dark_Green else if signal == 1 then Color.Dark_Red else Color.Dark_Orange);
AssignBackgroundCOlor(if signal == 2 then Color.Dark_Green else if signal == 1 then Color.Dark_Red else Color.Dark_Orange);

Shareable Link

https://tos.mx/pFX3vh

9qEjpEk.png


Credit:
 

Attachments

  • fsstyZX.png
    fsstyZX.png
    20 KB · Views: 193
  • 9qEjpEk.png
    9qEjpEk.png
    146.6 KB · Views: 180
Last edited:
Hi Everyone,

I'm new to trading and been papertrading for a few months. I'm a big fan of MACD and DMI and I'm trying to setup a simple MACD scanner. Basically, MACD crosses the 0 line or MACD crosses the DMI-. Sounds simple, but nothing comes up on my scanner. I even changed the time and still nothing. Please, can someone let me know what I'm doing wrong here.

For some reason, I'm not able to post an image. Here are my settings:

Study MACD Crosses Value 0.0 within 1 bars

Thanks in advance,
Art
 
There is a setting in the default MACD indicator that lets you turn on breakout signals. Did you try that? If that's what you're looking for, you can use the Scanner with it.
 
@Art ToS has a MACDhistogram crossover standard. Just look in scanner under crossover.

MACD cross -Di ;;;; MACD()."Value" crosses DIMinus() within 3 bars
 
Hi Marcos and Ben,

Thanks for your inputs!

Ben, the breakout signal is on, I can see them on my chart. But that's not what I'm trying to do. I want the signal only when the macd crosses 0

Please see what I mean

sOWLgKm.png


Marcos, I'm setting up the scanner under a watchlist, however the settings are the same. Actually, I already have several other scanners under my watchlists and they do the work, never used the Hack Scanner. It's only the MACD one that doesn't work. Do you know if the Hack Scanner and ?

Here are my settings

WWaiWK4.png


Appreciate your time.
Art
 

Attachments

  • sOWLgKm.png
    sOWLgKm.png
    14.2 KB · Views: 160
  • WWaiWK4.png
    WWaiWK4.png
    52.6 KB · Views: 164
Hi, apologies in advance for what might be a basic question but where do I input the script for this watchlist please? I am pretty new to Thinkorswim so still finding my feet and have created a standard watchlist but the section to open / create this particular option with the MACD crossover script eludes me right now.
Thank you
 
@mrmac It's under Watchlist > Customize > Custom Quotes. Select one of the option in there and paste the code in. Also, be sure to adjust the timeframe.
 
Someone already did this. Maybe search for it. Here is the code anyway.
Code:
#====== MACD.value is above MACD.avg (signal line)======
input fastLength_1 = 12;
input slowLength_1 = 26;
input MACDLength_1 = 9;
input AverageType_1 = {SMA, default EMA};
def macd_Val_1 = MACD(fastLength_1, slowLength_1, MACDLength_1, AverageType_1).Value;
def macd_Avg1 = MACD(fastLength_1, slowLength_1, MACDLength_1, AverageType_1).Avg;
AssignPriceColor(if macd_Val_1 > macd_Avg1 then Color.GREEN else  Color.RED );
#== end ====
 
Should have said so.

Code:
# MACD 4 color_colored candles

input fastLength = 12;
input slowLength = 26;
input MACDLength = 9;
input averageType = AverageType.EXPONENTIAL;

plot Diff = MACD(fastLength, slowLength, MACDLength, averageType).Diff;

AssignPriceColor(if Diff >= 0 then if Diff > Diff[1] then color.GREEN else color.DARK_GREEN else if Diff < Diff[1] then color.RED else color.DARK_RED);
 
Hello everyone. I'm new here, and I hope I'm posting this request in the appropriate forum/thread.

I'm not a coder but trying to learn some of the basics, and I'm hoping someone can help me with what I thought was going to be a relatively easy add-on to an existing code. What I'm trying to accomplish is to add color plots to the existing MACD in TOS, based on whether the fast line, slow line, and MACD lines are rising or falling.

I copied the existing code from the default MACD, created a new indicator and pasted that code into it, then added the following;

Code:
fastLength.DefineColor("Up", GetColor(1));

fastLength.DefineColor("Down", GetColor(0));

fastLength.AssignValueColor(if fastLength > fastLength [1] then fastLength.color("Up") else fastLength.color("Down"));

slowLength.DefineColor("Up", GetColor(1));

slowLength.DefineColor("Down", GetColor(0));

slowLength.AssignValueColor(if slowLength > slowLength [1] then slowLength.color("Up") else slowLength.color("Down"));

MACDLength.DefineColor("Up", GetColor(1));

MACDLength.DefineColor("Down", GetColor(0));

MACDLength.AssignValueColor(if MACDLength > MACDLength [1] then MACDLength.color("Up") else MACDLength.color("Down"));

Thought it would be fairly straight-forward, but since I know next to nothing about coding, it has turned out to be a challenge and I'm getting multiple errors. I'm hoping one of you experts on here would be able to look at this and tell me what I'm doing wrong?

Thank you so much!

If you would like to see the entire code, here it is;

Code:
declare lower;

input fastLength = 12;

input slowLength = 26;

input MACDLength = 9;

input averageType = AverageType.EXPONENTIAL;

input showBreakoutSignals = no;


plot Value = MovingAverage(averageType, close, fastLength) - MovingAverage(averageType, close, slowLength);

plot Avg = MovingAverage(averageType, Value, MACDLength);


plot Diff = Value - Avg;

plot ZeroLine = 0;


plot UpSignal = if Diff crosses above ZeroLine then ZeroLine else Double.NaN;

plot DownSignal = if Diff crosses below ZeroLine then ZeroLine else Double.NaN;


UpSignal.SetHiding(!showBreakoutSignals);

DownSignal.SetHiding(!showBreakoutSignals);


Value.SetDefaultColor(GetColor(1));

Avg.SetDefaultColor(GetColor(8));

Diff.SetDefaultColor(GetColor(5));

Diff.SetPaintingStrategy(PaintingStrategy.HISTOGRAM);

Diff.SetLineWeight(3);

Diff.DefineColor("Positive and Up", Color.GREEN);

Diff.DefineColor("Positive and Down", Color.DARK_GREEN);

Diff.DefineColor("Negative and Down", Color.RED);

Diff.DefineColor("Negative and Up", Color.DARK_RED);

Diff.AssignValueColor(if Diff >= 0 then if Diff > Diff[1] then Diff.color("Positive and Up") else Diff.color("Positive and Down") else if Diff < Diff[1] then Diff.color("Negative and Down") else Diff.color("Negative and Up"));

ZeroLine.SetDefaultColor(GetColor(0));

UpSignal.SetDefaultColor(Color.UPTICK);

UpSignal.SetPaintingStrategy(PaintingStrategy.ARROW_UP);

DownSignal.SetDefaultColor(Color.DOWNTICK);

DownSignal.SetPaintingStrategy(PaintingStrategy.ARROW_DOWN);

fastLength.SetDefaultColor(GetColor(9));

slowLength.SetDefaultColor(GetColor(5));

MACDLength.SetDefaultColor(GetColor(8));


fastLength.DefineColor("Up", GetColor(1));

fastLength.DefineColor("Down", GetColor(0));

fastLength.AssignValueColor(if fastLength > fastLength [1] then fastLength.color("Up") else fastLength.color("Down"));

slowLength.DefineColor("Up", GetColor(1));

slowLength.DefineColor("Down", GetColor(0));

slowLength.AssignValueColor(if slowLength > slowLength [1] then slowLength.color("Up") else slowLength.color("Down"));

MACDLength.DefineColor("Up", GetColor(1));

MACDLength.DefineColor("Down", GetColor(0));

MACDLength.AssignValueColor(if MACDLength > MACDLength [1] then MACDLength.color("Up") else MACDLength.color("Down"));

FYI, I didn't change any of the code from the existing MACD, but only added the color plots at the end.
 
Last edited by a moderator:
Is this code portable for the scanner tab? Do a bullish crossover on a timeframe or a bearish one?
 
@sobiswas You can setup a scanner for the MACD crossover via the Scan tab. This is only for the watchlist column.
 
It looks only working on daily time frame; Not working on hour or miniuets. Can you please fix it? Thank You!
 
@Bill1000 You need to adjust the watchlist to the timeframe you want. By default, it is set to Daily (D).
 

Join useThinkScript to post your question to a community of 21,000+ developers and traders.

Similar threads

Not the exact question you're looking for?

Start a new thread and receive assistance from our community.

87k+ Posts
453 Online
Create Post

Similar threads

Similar threads

The Market Trading Game Changer

Join 2,500+ subscribers inside the useThinkScript VIP Membership Club
  • Exclusive indicators
  • Proven strategies & setups
  • Private Discord community
  • ‘Buy The Dip’ signal alerts
  • Exclusive members-only content
  • Add-ons and resources
  • 1 full year of unlimited support

Frequently Asked Questions

What is useThinkScript?

useThinkScript is the #1 community of stock market investors using indicators and other tools to power their trading strategies. Traders of all skill levels use our forums to learn about scripting and indicators, help each other, and discover new ways to gain an edge in the markets.

How do I get started?

We get it. Our forum can be intimidating, if not overwhelming. With thousands of topics, tens of thousands of posts, our community has created an incredibly deep knowledge base for stock traders. No one can ever exhaust every resource provided on our site.

If you are new, or just looking for guidance, here are some helpful links to get you started.

What are the benefits of VIP Membership?
VIP members get exclusive access to these proven and tested premium indicators: Buy the Dip, Advanced Market Moves 2.0, Take Profit, and Volatility Trading Range. In addition, VIP members get access to over 50 VIP-only custom indicators, add-ons, and strategies, private VIP-only forums, private Discord channel to discuss trades and strategies in real-time, customer support, trade alerts, and much more. Learn all about VIP membership here.
How can I access the premium indicators?
To access the premium indicators, which are plug and play ready, sign up for VIP membership here.
Back
Top