MACD Format, Triggers, Scan, Label, Watchlist For ThinkOrSwim

I'm trying to add this MACD Script to use in a watchlist but it's not working when I copy and paste the script.
I found the steps to this script in a video on youtube
Below is what you have coded so far.
This was an excellent attempt. I wouldn't use this watchlist. It makes gross assumptions such as because it hasn't crossed its average yet, the trend is decreasing.
You need to add logic which looks at whether the trend is sloping up or down: value>value[1] and avg>avg[1]
Find an example here:
https://usethinkscript.com/threads/...chlist-for-thinkorswim.7745/page-6#post-74492

If you fix this, we appreciate if you come back and share.
RdjpJf1.png

Ruby:
def fastlength = 12;
def slowlength = 26;
def MACDLength = 9;
def averageType = AverageType.EXPONENTIAL;
def showBreakoutSignals = no;
def ZeroLine = 0;
def Value = MovingAverage (averageType, close, fastlength) – MovingAverage (averageType, close, slowlength);
def Avg = MovingAverage (averageType, Value, MACDLength);
def Diff = Value – Avg;

addlabel (yes,
if value >= zeroline and avg >= zeroline and value crosses below avg within 3 bars then “Cross OB” else
if value <= zeroline and avg <= zeroline and value crosses above avg within 3 bars then “Cross OS” else
if value >= zeroline and avg >= zeroline and value > avg then “Bull Acc” else
if value >= zeroline and avg >= zeroline and value < avg then “Bull Dec” else
if value <= zeroline and avg <= zeroline and value < avg  then “Bear Acc” else
if value <= zeroline and avg <= zeroline and value > avg then “Bear Dec” else "_");

AssignBackgroundColor(
if value >= zeroline and avg >= zeroline and value crosses below avg within 3 bars then color.cyan else
if value <= zeroline and avg <= zeroline and value crosses above avg within 3 bars then color.dark_orange else
if value >= zeroline and avg >= zeroline and value > avg then  color.lime else
if value >= zeroline and avg >= zeroline and value < avg then color.green else
if value <= zeroline and avg <= zeroline and value < avg  then color.red else
if value <= zeroline and avg <= zeroline and value > avg then color.pink else color.light_gray);
 
Last edited:

Join useThinkScript to post your question to a community of 21,000+ developers and traders.

Hi @MerryDay,

While setting up watchlist I am getting error from thinkscript editor saying "AddLabel is not allowed in this context". Any help would be appreciated.

Thank you
 
Hi @MerryDay,

While setting up watchlist I am getting error from thinkscript editor saying "AddLabel is not allowed in this context". Any help would be appreciated.

Thank you
Unfortunately, as you didn't specify which script you're working on, so it's hard to say exactly where you might have gone wrong.

Here's a tutorial on creating a custom watchlist column: https://usethinkscript.com/threads/...hlist-column-a-tutorial-for-thinkorswim.9709/
And here's a tutorial on using the ThinkOrSwim Stock Hacker scans: https://usethinkscript.com/threads/how-to-use-thinkorswim-stock-hacker-scans.284/

Without more information, providing further help is not possible.
When making future posts, it is important to understand what you did and where you did it.
It is requested that a DETAILED post of the steps taken be provided.
To better understand the issue, it is necessary to see what is being encountered.
Therefore, it is requested that the following be posted:
  • Always provide the code that was copied and pasted. Even if it is thought to be the same as the one on the forum, it still needs to be seen. There may be a missing part of the code that is causing the issue.
  • Always provide a screenshot of the problem. Annotate the image, highlighting which widget you are working in, along with a more detailed written explanation. This will help others to better understand the question and provide more specific information to work with.
If unsure of how to upload screenshots to the forum, easy-to-follow directions are available at https://usethinkscript.com/threads/answers-to-commonly-asked-questions.6006/#post-58714

When a watchlist script from this thread is inserted into the custom quote condition wizard, it should not result in an error:
KvUdwrg.png
 
Last edited:
MACD Label & WatchList
@Baller4lfe When the value is greater than average AND is trending up it creates a positive momentum.
Instead of just above avg and below avg... Included is:

MACD TrendingMACD Watch ItMACD FallingMACD Rising
Value > Avg
Value is trending up
Value > Avg
Value is trending down
Value < Avg
Value is trending down
Value < Avg
Value is trending up
color greencolor dark graycolor redcolor dark green
The number in the label is the difference between value and average.

Upper Study Label and Lower Study Indicator
Shared Chart Link: http://tos.mx/6v2K0kT Click here for --> Easiest way to load shared links
View attachment 854
WatchList
View attachment 859


Upper Chart Study
Ruby:
# ########################################################
# MACD with a more Normal Distribution by Mobius V01.09.2015
#Hint: Plots a Gaussian distribution. If Normal Distribution is met, then at minimum, 68.2% of the close values should be inside a One Standard Deviation Envelope and 95.4% of the close values should be inside a 2 Standard Deviation Envelope.

input fastLength = 8 ; # short 6, 13, 6 BB length 5
input slowLength = 17; # default 8 17 9
input MACDLength = 9;
input showBreakoutSignals = yes;
input ma_length = 21; #Length(180-200 for floating S/R , 55 for swing entry)

# Four Pole Filter
script g {
    input length = 4;
    input betaDev = 2;
    input price = OHLC4;
    def c;
    def w;
    def beta;
    def alpha;
    def G;
    c = price;
    w = (2 * Double.Pi / length);
    beta = (1 - Cos(w)) / (Power(1.414, 2.0 / betaDev) - 1 );
    alpha = (-beta + Sqrt(beta * beta + 2 * beta));
    G = Power(alpha, 4) * c +
4 * (1 – alpha) * G[1] – 6 * Power( 1 - alpha, 2 ) * G[2] +
4 * Power( 1 - alpha, 3 ) * G[3] - Power( 1 - alpha, 4 ) * G[4];
    plot Line = G;
}

#My Standard Chart Colors
# Modified MACD
def MACD_Value = g(length = fastLength) - g(length = slowLength);
def MACD_Avg = g(price = MACD_Value, length = MACDLength);
def Diff = MACD_Value - MACD_Avg;

def PositiveUp   = MACD_Value > MACD_Value[1] and MACD_Value > MACD_Avg ;
def NegativeUp   = MACD_Value < MACD_Value[1] and MACD_Value > MACD_Avg ;
def NegativeDown = MACD_Value < MACD_Value[1] and MACD_Value < MACD_Avg ;
def PostiveDown  = MACD_Value > MACD_Value[1] and MACD_Value < MACD_Avg ;

plot Buy_scan = MACD_value < 0 and MACD_value >= MACD_value[1] and MACD_Value crosses above MACD_Avg ;
plot Sell_scan =  MACD_value < MACD_avg and MACD_value < MACD_value[1] ;
Buy_scan.Hide();
Sell_scan.Hide();
plot Buy_signal = if Buy_scan and !Buy_scan[1] then MACD_value else double.NaN  ;
Buy_signal.SetPaintingStrategy(PaintingStrategy.LINE_Vs_poINTS);
Buy_signal.SetDefaultColor(color.cyan) ;
Buy_signal.SetLineWeight(5);
plot sell_signal = if sell_scan and !sell_scan[1] then MACD_value else double.NaN  ;
sell_signal.SetPaintingStrategy(PaintingStrategy.LINE_Vs_poINTS);
sell_signal.SetDefaultColor(color.magenta) ;
sell_signal.SetLineWeight(5);

# ########################################################
# Charting and Formatting
DefineGlobalColor("Pre_Cyan", CreateColor(50, 200, 255)) ;
DefineGlobalColor("LabelGreen",  CreateColor(0, 165, 0)) ;

input ShowLabels = yes ;
AddLabel(ShowLabels,
if buy_scan then "MACD Trend Begin" else
if sell_scan and !sell_scan[1] then "MACD Trend End" else
if PositiveUp then "MACD Trending " + Round(Diff, 1) else
if PostiveDown then "MACD Rising " + Round(Diff, 1) else
if NegativeUp then "MACD Watch It " + Round(Diff, 1) else
if NegativeDown then "MACD Falling " + Round(Diff, 1) else "MACD Wait ",
if buy_scan then GlobalColor("Pre_Cyan") else
if sell_scan and !sell_scan[1] then color.magenta else
if PositiveUp then GlobalColor("LabelGreen") else
if PostiveDown then color.dark_green else
if NegativeUp then Color.DARK_gray else
if NegativeDown then Color.RED else
 Color.GRAY);

Lower Study Indicator
Ruby:
declare lower;
# ########################################################
# MACD with a more Normal Distribution by Mobius V01.09.2015
#Hint: Plots a Gaussian distribution. If Normal Distribution is met, then at minimum, 68.2% of the close values should be inside a One Standard Deviation Envelope and 95.4% of the close values should be inside a 2 Standard Deviation Envelope.

input fastLength = 8 ; # short 6, 13, 6 BB length 5
input slowLength = 17; # default 8 17 9
input MACDLength = 9;
input showBreakoutSignals = yes;
input ma_length = 21; #Length(180-200 for floating S/R , 55 for swing entry)

# Four Pole Filter
script g {
    input length = 4;
    input betaDev = 2;
    input price = OHLC4;
    def c;
    def w;
    def beta;
    def alpha;
    def G;
    c = price;
    w = (2 * Double.Pi / length);
    beta = (1 - Cos(w)) / (Power(1.414, 2.0 / betaDev) - 1 );
    alpha = (-beta + Sqrt(beta * beta + 2 * beta));
    G = Power(alpha, 4) * c +
4 * (1 – alpha) * G[1] – 6 * Power( 1 - alpha, 2 ) * G[2] +
4 * Power( 1 - alpha, 3 ) * G[3] - Power( 1 - alpha, 4 ) * G[4];
    plot Line = G;
}

plot zeroline = 0 ;
zeroline.SetDefaultColor(Color.GRAY);

# Modified MACD
def MACD_Value = g(length = fastLength) - g(length = slowLength);
plot MACD_Avg = g(price = MACD_Value, length = MACDLength);
def Diff = MACD_Value - MACD_Avg;
AddCloud(MACD_Value, MACD_Avg, Color.GREEN, Color.RED);

def PositiveUp   = MACD_Value > MACD_Value[1] and MACD_Value > MACD_Avg ;
def NegativeUp   = MACD_Value < MACD_Value[1] and MACD_Value > MACD_Avg ;
def NegativeDown = MACD_Value < MACD_Value[1] and MACD_Value < MACD_Avg ;
def PostiveDown  = MACD_Value > MACD_Value[1] and MACD_Value < MACD_Avg ;
# ########################################################
# Charting and Formatting
DefineGlobalColor("Pre_Cyan", CreateColor(50, 200, 255)) ;
DefineGlobalColor("LabelGreen",  CreateColor(0, 165, 0)) ;

plot Buy_scan = MACD_value < 0 and MACD_value >= MACD_value[1] and MACD_Value crosses above MACD_Avg ;
plot Sell_scan =  MACD_value < MACD_avg and MACD_value < MACD_value[1] ;
Buy_scan.Hide();
Sell_scan.Hide();
plot Buy_signal = if Buy_scan and !Buy_scan[1] then MACD_value else double.NaN  ;
Buy_signal.SetPaintingStrategy(PaintingStrategy.LINE_Vs_poINTS);
Buy_signal.SetDefaultColor(color.cyan) ;
Buy_signal.SetLineWeight(5);
plot sell_signal = if sell_scan and !sell_scan[1] then MACD_value else double.NaN  ;
sell_signal.SetPaintingStrategy(PaintingStrategy.LINE_Vs_poINTS);
sell_signal.SetDefaultColor(color.magenta) ;
sell_signal.SetLineWeight(5);
# ########################################################
plot MACD_dots = MACD_Value ;
MACD_dots.AssignValueColor(
if buy_scan then GlobalColor("Pre_Cyan") else
if sell_scan and !sell_scan[1] then color.magenta else
if PositiveUp then GlobalColor("LabelGreen") else
if PostiveDown then color.dark_green else
if NegativeUp then Color.DARK_gray else
if NegativeDown then Color.RED else
 Color.GRAY);
MACD_dots.SetPaintingStrategy(PaintingStrategy.LINE_VS_POINTS);
MACD_dots.SetLineWeight(1);
# ########################################################
input ShowLabels = yes ;
AddLabel(ShowLabels,
if buy_scan then "MACD Trend Begin" else
if sell_scan and !sell_scan[1] then "MACD Trend End" else
if PositiveUp then "MACD Trending " + Round(Diff, 1) else
if PostiveDown then "MACD Rising " + Round(Diff, 1) else
if NegativeUp then "MACD Watch It " + Round(Diff, 1) else
if NegativeDown then "MACD Falling " + Round(Diff, 1) else "MACD Wait ",
if buy_scan then GlobalColor("Pre_Cyan") else
if sell_scan and !sell_scan[1] then color.magenta else
if PositiveUp then GlobalColor("LabelGreen") else
if PostiveDown then color.dark_green else
if NegativeUp then Color.DARK_gray else
if NegativeDown then Color.RED else
 Color.GRAY);

WatchList
Ruby:
# ########################################################
# MACD with a more Normal Distribution by Mobius V01.09.2015
#Hint: Plots a Gaussian distribution. If Normal Distribution is met, then at minimum, 68.2% of the close values should be inside a One Standard Deviation Envelope and 95.4% of the close values should be inside a 2 Standard Deviation Envelope.

input fastLength = 8 ; # short 6, 13, 6 BB length 5
input slowLength = 17; # default 8 17 9
input MACDLength = 9;
input showBreakoutSignals = yes;
input ma_length = 21; #Length(180-200 for floating S/R , 55 for swing entry)

# Four Pole Filter
script g {
    input length = 4;
    input betaDev = 2;
    input price = OHLC4;
    def c;
    def w;
    def beta;
    def alpha;
    def G;
    c = price;
    w = (2 * Double.Pi / length);
    beta = (1 - Cos(w)) / (Power(1.414, 2.0 / betaDev) - 1 );
    alpha = (-beta + Sqrt(beta * beta + 2 * beta));
    G = Power(alpha, 4) * c +
4 * (1 – alpha) * G[1] – 6 * Power( 1 - alpha, 2 ) * G[2] +
4 * Power( 1 - alpha, 3 ) * G[3] - Power( 1 - alpha, 4 ) * G[4];
    plot Line = G;
}

#My Standard Chart Colors
# Modified MACD
def MACD_Value = g(length = fastLength) - g(length = slowLength);
def MACD_Avg = g(price = MACD_Value, length = MACDLength);
def Diff = MACD_Value - MACD_Avg;

def PositiveUp   = MACD_Value > MACD_Value[1] and MACD_Value > MACD_Avg ;
def NegativeUp   = MACD_Value < MACD_Value[1] and MACD_Value > MACD_Avg ;
def NegativeDown = MACD_Value < MACD_Value[1] and MACD_Value < MACD_Avg ;
def PostiveDown  = MACD_Value > MACD_Value[1] and MACD_Value < MACD_Avg ;

plot Buy_scan = MACD_value < 0 and MACD_value >= MACD_value[1] and MACD_Value crosses above MACD_Avg ;
plot Sell_scan =  MACD_value < MACD_avg and MACD_value < MACD_value[1] ;
Buy_scan.Hide();
Sell_scan.Hide();
plot Buy_signal = if Buy_scan and !Buy_scan[1] then MACD_value else double.NaN  ;
Buy_signal.SetPaintingStrategy(PaintingStrategy.LINE_Vs_poINTS);
Buy_signal.SetDefaultColor(color.cyan) ;
Buy_signal.SetLineWeight(5);
plot sell_signal = if sell_scan and !sell_scan[1] then MACD_value else double.NaN  ;
sell_signal.SetPaintingStrategy(PaintingStrategy.LINE_Vs_poINTS);
sell_signal.SetDefaultColor(color.magenta) ;
sell_signal.SetLineWeight(5);

# ########################################################
# Charting and Formatting
DefineGlobalColor("Pre_Cyan", CreateColor(50, 200, 255)) ;
DefineGlobalColor("LabelGreen",  CreateColor(0, 165, 0)) ;

input ShowLabels = yes ;
AddLabel(ShowLabels,
if buy_scan then "Begin" else
if sell_scan and !sell_scan[1] then "End" else
if PositiveUp then "👍 " + Round(Diff, 1) else
if PostiveDown then "👍 " + Round(Diff, 1) else
if NegativeUp then "Chg'g " + Round(Diff, 1) else
if NegativeDown then "👎 " + Round(Diff, 1) else " ");
AssignBackgroundColor(
if buy_scan then color.cyan else
if sell_scan and !sell_scan[1] then color.magenta else
if PositiveUp then CreateColor(50, 200, 255) else
if PostiveDown then CreateColor(0, 165, 0) else
if NegativeUp then Color.gray else
if NegativeDown then Color.RED else
 Color.GRAY);
Impressive.
The very best approach to MACD that I have ever run accross. And everthing is included!
Thank you
 
@raymasa Actually, I was bored and curiosity got the best of me so I coded a replica based off the standard TOS MACD indicator... I never checked to see whether a comparable script might already be posted here in the forums... It didn't take long considering how my initial reply was only about 1H 15m ago, and I did a few other things along the way... Just goes to show how easy code can be tweaked with very little effort...

Ruby:
# MACD_with_Signals_and_ColorBars
# Adapted from Tradingview MACD_with_Signals
# https://www.tradingview.com/script/ETBoNc7O-MACD-with-Signals/
# Based on TOS MACD with additional features
# TD Ameritrade IP Company, Inc. (c) 2007-2021
# Created by rad14733 for usethinkscript.com
# v1.0 : 2021-02-25 : Initial release

declare lower;

input fastLength = 12;
input slowLength = 26;
input MACDLength = 9;
input averageType = AverageType.EXPONENTIAL;
input showBreakoutSignals = yes;
input colorChartBars = yes;

plot Diff = MACD(fastLength, slowLength, MACDLength, averageType).Diff;
Diff.SetDefaultColor(GetColor(5));
Diff.SetPaintingStrategy(PaintingStrategy.HISTOGRAM);
Diff.SetLineWeight(3);
Diff.DefineColor("Positive and Up", Color.GREEN);
Diff.DefineColor("Positive and Down", Color.BLUE);
Diff.DefineColor("Negative and Down", Color.RED);
Diff.DefineColor("Negative and Up", Color.YELLOW);
Diff.AssignValueColor(if Diff >= 0 then if Diff > Diff[1] then Diff.color("Positive and Up") else Diff.color("Positive and Down") else if Diff < Diff[1] then Diff.color("Negative and Down") else Diff.color("Negative and Up"));

plot UpSignal = if Diff crosses above 0 then 0 else Double.NaN;
UpSignal.SetDefaultColor(Color.UPTICK);
UpSignal.SetPaintingStrategy(PaintingStrategy.ARROW_UP);
UpSignal.SetLineWeight(2);
UpSignal.SetHiding(!showBreakoutSignals);

plot DownSignal = if Diff crosses below 0 then 0 else Double.NaN;
DownSignal.SetDefaultColor(Color.DOWNTICK);
DownSignal.SetPaintingStrategy(PaintingStrategy.ARROW_DOWN);
DownSignal.SetLineWeight(2);
DownSignal.SetHiding(!showBreakoutSignals);

plot Value = MACD(fastLength, slowLength, MACDLength, averageType).Value;
Value.SetDefaultColor(Color.CYAN);
Value.DefineColor("UpTrend", Color.CYAN);
Value.DefineColor("DownTrend", Color.MAGENTA);
Value.AssignValueColor(if Value > Value[1] then Value.color("UpTrend") else if Value < Value[1] then Value.color("DownTrend") else Color.CURRENT);
Value.SetLineWeight(2);

plot Avg = MACD(fastLength, slowLength, MACDLength, averageType).Avg;
Avg.SetDefaultColor(Color.DARK_ORANGE);
Avg.SetLineWeight(1);

plot ZeroLine = 0;
ZeroLine.SetDefaultColor(Color.WHITE);
ZeroLine.SetLineWeight(1);

AssignPriceColor(if colorChartBars then if Diff >= 0 then if Diff > Diff[1] then Diff.color("Positive and Up") else Diff.color("Positive and Down") else if Diff < Diff[1] then Diff.color("Negative and Down") else Diff.color("Negative and Up") else Color.CURRENT);

# END - MACD_with_Signals_and_ColorBars

pS18n1I.png

how i would put an arrow on the curve of the fast line going up or down thats why i asked RAD cuz his is the closest to what im looking for
 
Last edited by a moderator:
Hi Im using a macd with wilders moving average. this current script changes color with the macdline starts curling up or down. I want this to show on mobile too. is there a way to add an up/down arrow right at the change that will show up on mobile?

here is the script
declare lower;

input fastLength = 12;
input slowLength = 26;
input MACDLength = 9;
input averageType = AverageType.Wilders;
input showBreakoutSignals = no;

plot Value = MovingAverage(averageType, close, fastLength) - MovingAverage(averageType, close, slowLength);
plot Avg = MovingAverage(averageType, Value, MACDLength);

plot Diff = Value - Avg;
plot ZeroLine = 0;

plot UpSignal = if Diff crosses above ZeroLine then ZeroLine else Double.NaN;
plot DownSignal = if Diff crosses below ZeroLine then ZeroLine else Double.NaN;

UpSignal.SetHiding(!showBreakoutSignals);
DownSignal.SetHiding(!showBreakoutSignals);

Value.DefineColor("Up", Color.GREEN);
Value.DefineColor("Down", Color.RED);
Value.DefineColor("Even", Color.WHITE);
Value.AssignValueColor(if Value > Value[1] then Value.Color("Up") else (if Value == Value[1] then Value.Color("Even") else Value.Color("Down")));
Value.SetLineWeight(1);
Avg.SetDefaultColor(GetColor(8));
Diff.SetDefaultColor(GetColor(5));
Diff.SetPaintingStrategy(PaintingStrategy.HISTOGRAM);
Diff.SetLineWeight(3);
Diff.DefineColor("Positive and Up", Color.GREEN);
Diff.DefineColor("Positive and Down", Color.DARK_GREEN);
Diff.DefineColor("Negative and Down", Color.RED);
Diff.DefineColor("Negative and Up", Color.DARK_RED);
Diff.AssignValueColor(if Diff >= 0 then if Diff > Diff[1] then Diff.color("Positive and Up") else Diff.color("Positive and Down") else if Diff < Diff[1] then Diff.color("Negative and Down") else Diff.color("Negative and Up"));
ZeroLine.SetDefaultColor(GetColor(0));
UpSignal.SetDefaultColor(Color.UPTICK);
UpSignal.SetPaintingStrategy(PaintingStrategy.ARROW_UP);
DownSignal.SetDefaultColor(Color.DOWNTICK);
DownSignal.SetPaintingStrategy(PaintingStrategy.ARROW_DOWN);


seems gymini has the same idea as me. If anyone is able to help that'd be greatly appreciated.
 
Last edited by a moderator:
@Gymini @dpxpress You are looking for arrows when it "starts to curve up" or "starts to curve down"
The definition would be if MACD was sloping down and then starts to curve up.

The Thinkscript syntax is: value on the last bar is less than the value on the bar previous to that and
the current value is greater than the previous bar
Ruby:
 value[1]<=value[2] and value>value[1]

This code can be added to the bottom of your favorite MACD script (lower indicator):
Ruby:
plot curvingUP = value[1]<=value[2] and value>value[1] ;
plot curvingDN = value[1]>=value[2] and value<value[1] ;
     curvingUP.SetPaintingStrategy(PaintingStrategy.BOOLEAN_ARROW_UP);
     curvingDN.SetPaintingStrategy(PaintingStrategy.BOOLEAN_ARROW_DOWN);
nhgUKdP.png

shared chart link: http://tos.mx/lBfhC7e Click here for --> Easiest way to load shared links
 
Last edited:
@Gymini @dpxpress You are looking for arrows when it "starts to curve up" or "starts to curve down"
The definition would be if MACD was sloping down and then starts to curve up.

The Thinkscript syntax is: value on the last bar is less than the value on the bar previous to that and
the current value is greater than the previous bar
Ruby:
 value[1]<=value[2] and value>value[1]

This code can be added to the bottom of your favorite MACD script (lower indicator):
Ruby:
plot curvingUP = value[1]<=value[2] and value>value[1] ;
plot curvingDN = value[1]>=value[2] and value<value[1] ;
     curvingUP.SetPaintingStrategy(PaintingStrategy.BOOLEAN_ARROW_UP);
     curvingDN.SetPaintingStrategy(PaintingStrategy.BOOLEAN_ARROW_DOWN);
nhgUKdP.png

shared chart link: http://tos.mx/lBfhC7e Click here for --> Easiest way to load shared links
i really appreciate this thank you.... .now a scan, watchlist, column, different colors and an alert from ALEXA when it starts to curve plz.... just joking. Again thank you
 
@Gymini @dpxpress You are looking for arrows when it "starts to curve up" or "starts to curve down"
The definition would be if MACD was sloping down and then starts to curve up.

The Thinkscript syntax is: value on the last bar is less than the value on the bar previous to that and
the current value is greater than the previous bar
Ruby:
 value[1]<=value[2] and value>value[1]

This code can be added to the bottom of your favorite MACD script (lower indicator):
Ruby:
plot curvingUP = value[1]<=value[2] and value>value[1] ;
plot curvingDN = value[1]>=value[2] and value<value[1] ;
     curvingUP.SetPaintingStrategy(PaintingStrategy.BOOLEAN_ARROW_UP);
     curvingDN.SetPaintingStrategy(PaintingStrategy.BOOLEAN_ARROW_DOWN);
nhgUKdP.png

shared chart link: http://tos.mx/lBfhC7e Click here for --> Easiest way to load shared links
TYSM!! ur awesome
 
Q: How do I get that shading the "shading" of green and red, semi transparent between the MACD & the signal line? Thanks
 
Last edited by a moderator:
I am trying to add a chart bubble when the macd "downsignal" or "upsignal" is true. I want the bubble to say "Buy" for the buysignal and "Sell" for the downsignal. I looked at tos thinkscript tutorials and other code that used this function and it seems like I am using the right format but can't get it to work. If someone could help me out it would be much appreciated. I duplicated the tos MACD indicator and added these lines for the chart bubbles:(
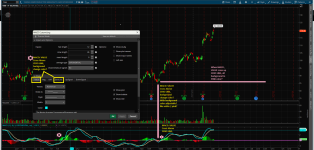
the plots below are from the macd code I just wanted to show where I placed my addchartbubble code. Thank you.

plot UpSignal = if Diff crosses above ZeroLine then ZeroLine else Double.NaN;

addchartbubble(upsignal,close,"Buy",color.LIGHT_GREEN,no);

plot DownSignal = if Diff crosses below ZeroLine then ZeroLine else Double.NaN;

addchartbubble(downsignal,close,"Sell",color.LIGHT_red,no);
 
Thank you for providing the context for your reply to my question. I copied your solution and replaced my code with yours and it still is not working.

Assuming your are using a lower indicator, MACD, on the price panel, it is easier to change most of the plots of the MACD to def statements and use price panel values.

See if this version helps. It has a price coloring option to go with your buy/sell signals.

Screenshot 2023-08-09 163637.png
Code:
input pricecolor = yes;
input fastLength = 12;
input slowLength = 26;
input MACDLength = 9;
input averageType = AverageType.EXPONENTIAL;

def Value = MovingAverage(averageType, close, fastLength) - MovingAverage(averageType, close, slowLength);
def Avg = MovingAverage(averageType, Value, MACDLength);

plot Diff = Value - Avg;

Diff.Hide();
Diff.SetDefaultColor(GetColor(5));
Diff.SetPaintingStrategy(PaintingStrategy.HISTOGRAM);
Diff.SetLineWeight(3);
Diff.DefineColor("Positive and Up", Color.GREEN);
Diff.DefineColor("Positive and Down", Color.DARK_GREEN);
Diff.DefineColor("Negative and Down", Color.RED);
Diff.DefineColor("Negative and Up", Color.DARK_RED);
Diff.AssignValueColor(if Diff >= 0 then if Diff > Diff[1] then Diff.Color("Positive and Up") else Diff.Color("Positive and Down") else if Diff < Diff[1] then Diff.Color("Negative and Down") else Diff.Color("Negative and Up"));

AssignPriceColor(if !pricecolor then Color.CURRENT else Diff.TakeValueColor());

plot UpSignal = if Diff crosses above 0 then low else Double.NaN;

AddChartBubble(UpSignal, low, "Buy", Color.LIGHT_GREEN, no);

plot DownSignal = if Diff crosses below 0 then high else Double.NaN;

AddChartBubble(DownSignal, high, "Sell", Color.LIGHT_RED, yes);

#
 
Assuming your are using a lower indicator, MACD, on the price panel, it is easier to change most of the plots of the MACD to def statements and use price panel values.

See if this version helps. It has a price coloring option to go with your buy/sell signals.
That works! I was wondering if some of the rest of the code was getting in the way. I've seen the "double nan" used in other code and wondered about that, too. but it seemed that the upsignal /downsignal designation was pretty clear in the macd code so the problem of figuring it out on my own was beyond my skills. I appreciate the help! Thank you, Sleepy and Halcyon, for your time.

With the above "Buy/Sell" chart bubbles, is there a way to just populate the most recent signal or better yet have the option to toggle all signals or just recent? Thanks.

Assuming your are using a lower indicator, MACD, on the price panel, it is easier to change most of the plots of the MACD to def statements and use price panel values.

See if this version helps. It has a price coloring option to go with your buy/sell signals.
Is there a way to have the option to only show the current chart bubble? Thanks so much for your help on this.
 
Hi,
Can anyone help me covert this to a Label so I can save screen space, I tried but I can't seem to figure it out. Thanks

declare lower;

input price = close;
input MACDfastLength = 12;
input MACDslowLength = 26;
input MACDLength = 5;

def MACD_Data = MACD(fastLength = MACDfastLength, slowLength = MACDslowLength, MACDLength = MACDLength);

plot MACD_Dots = MACD_Data;
plot MACD_Line = MACD_Data;

MACD_Line.SetDefaultColor(Color.Green);

MACD_Dots.SetStyle(Curve.POINTS);
MACD_Dots.SetLineWeight(5);
MACD_Dots.AssignValueColor(if MACD_Line < 0 then Color.BLUE else Color.YELLOW);


plot zero = 0;
zero.AssignValueColor(if MACD_Line < 0 then Color.BLUE else Color.YELLOW);
zero.SetLineWeight(5);
def bear_cross = MACD_Line crosses below zero;
def Bull_cross = MACD_Line crosses above zero;

#Alerts
#Alert(bull_cross, "UP arrow alert", Alert.Bar, Sound.Chimes);
#Alert(bear_cross, "DOWN arrow alert", Alert.Bar, Sound.Chimes);
https://usethinkscript.com/threads/...chlist-for-thinkorswim.7745/page-6#post-74492
 
I wish I could create a watchlist for when the MACD is below the horizontal zero line. That would also be helpful, but nobody here has been able to create that or at least I've never seen it.
 
Last edited by a moderator:
I wish I could create a watchlist for when the MACD is below the horizontal zero line. That would also be helpful, but nobody here has been able to create that or at least I've never seen it.

Put this in a custom column in your watchlist

Screenshot 2023-12-14 164541.png
Code:
def diff = reference MACD().Diff;
AddLabel(1, diff, if diff < 0 then Color.RED else if diff > 0 then Color.GREEN else Color.WHITE);
AssignBackgroundColor(if diff < 0 then Color.RED else if diff > 0 then Color.GREEN else Color.WHITE);

#
 
Guys, anyone can help?
MACD: VALUE Cross Above ZERO LINE, background change color (color changeable, like white, pink or yellow)? See photo for explain. TQ
 

Attachments

  • Screenshot 2024-02-07 085538.MACD.VALUE Cross Above ZERO LINE background change color.png
    Screenshot 2024-02-07 085538.MACD.VALUE Cross Above ZERO LINE background change color.png
    406.6 KB · Views: 41
Guys, anyone can help?
MACD: VALUE Cross Above ZERO LINE, background change color (color changeable, like white, pink or yellow)? See photo for explain. TQ


i don't like changing the background color. can't see the bars, to see what is going on.
this has 3 options for drawing things when macd crosses zero
.. draw vertical line
.. change background color
.. draw a column of color between 2 bars


Code:
#macd_cross_zero

# do things when macd crosses zero
#  draw vertical line
#  change background color
#  draw a column of color between 2 bars


DefineGlobalColor("up", color.cyan);
DefineGlobalColor("dwn", color.yellow);
#NinetyPercent.SetDefaultColor(GlobalColor("up");

def na = double.nan;

def lvl = 0;
def v = macd().value;
def xup = v crosses above lvl;
def xdwn = v crosses below lvl;

def top = double.positive_INFINITY;
def bot = double.negative_INFINITY;

input change_back_color = yes;
AssignBackgroundColor(if !change_back_color then color.current else if xup then GlobalColor("up") else if xdwn then GlobalColor("dwn") else color.current);


# draw cloud between 2 bars , when a crossing
input cloud_columns = yes;
def cldtop = if !cloud_columns then na else if xup[-1] or xup then double.POSITIVE_INFINITY else na;
def cldbot = if !cloud_columns then na else if xdwn[-1] or xdwn then double.negative_INFINITY else na;
addcloud(cldtop, bot, GlobalColor("up"));
addcloud(top, cldbot, GlobalColor("dwn"));


input vert_lines = yes;
addverticalline(vert_lines and xup, "-", GlobalColor("up"));
addverticalline(vert_lines and xdwn, "-", GlobalColor("dwn"));
#
 

Attachments

  • img1.JPG
    img1.JPG
    142 KB · Views: 50
  • Like
Reactions: LLP

Similar threads

Not the exact question you're looking for?

Start a new thread and receive assistance from our community.

87k+ Posts
439 Online
Create Post

Similar threads

Similar threads

The Market Trading Game Changer

Join 2,500+ subscribers inside the useThinkScript VIP Membership Club
  • Exclusive indicators
  • Proven strategies & setups
  • Private Discord community
  • ‘Buy The Dip’ signal alerts
  • Exclusive members-only content
  • Add-ons and resources
  • 1 full year of unlimited support

Frequently Asked Questions

What is useThinkScript?

useThinkScript is the #1 community of stock market investors using indicators and other tools to power their trading strategies. Traders of all skill levels use our forums to learn about scripting and indicators, help each other, and discover new ways to gain an edge in the markets.

How do I get started?

We get it. Our forum can be intimidating, if not overwhelming. With thousands of topics, tens of thousands of posts, our community has created an incredibly deep knowledge base for stock traders. No one can ever exhaust every resource provided on our site.

If you are new, or just looking for guidance, here are some helpful links to get you started.

What are the benefits of VIP Membership?
VIP members get exclusive access to these proven and tested premium indicators: Buy the Dip, Advanced Market Moves 2.0, Take Profit, and Volatility Trading Range. In addition, VIP members get access to over 50 VIP-only custom indicators, add-ons, and strategies, private VIP-only forums, private Discord channel to discuss trades and strategies in real-time, customer support, trade alerts, and much more. Learn all about VIP membership here.
How can I access the premium indicators?
To access the premium indicators, which are plug and play ready, sign up for VIP membership here.
Back
Top