lowest lows of a period

WayneS

New member
@SleepyZ , may i ask a question about looping through to find lows, how would you code in ThinkScript to look over a certain period, say the last 60 or so bars and within that timeframe find what would be the lowest lows of that period, if it be 5 or only 2 low periods, any help, I have been reading other post trying to figure out how to do this, but need some direction.
 
Last edited by a moderator:
Solution
@SleepyZ , may i ask a question about looping through to find lows, how would you code in ThinkScript to look over a certain period, say the last 60 or so bars and within that timeframe find what would be the lowest lows of that period, if it be 5 or only 2 low periods, any help, I have been reading other post trying to figure out how to do this, but need some direction.

sounds similar to this
https://usethinkscript.com/threads/...times-a-condition-occurred.16392/#post-130398
 
Solution
Thank you so much, now I have to admit i am not a programmer. Can and will you give me some guidance on how the code you referred me to, can be changed to look over a period of choice and place dots on the lows of that time period, not every low, but only the lowest lows within that lookback period.


sorry, i think i referenced the wrong study in my previous post.
i thought about it again, and started with a ranking study, then ranked the lows.

pick how many bars back to look for lows
input bars_back = 60;

pick how many lowest lows to find in those bars
input qty_of_lows = 4;

draw yellow dots below the lows
draw a white square under the highest low
draw a horizontal line at the highest low


Code:
# find_x_lowestlows_over_past_x_bars

#https://usethinkscript.com/threads/lowest-lows-of-a-period.16185/
#lowest lows of a period

def bn = barnumber();
def na = double.nan;
def lastbn = HighestAll(If(IsNaN(close), 0, bn));
def lastbar = if (bn == lastbn) then 1 else 0;
# def lastbar = !isnan(close[0]) and isnan(close[-1]);

def big = 99999;
input bars_back = 60;
def xback = (!isnan(close[-(bars_back-1)]) and isnan(close[-(bars_back+0)]));
#def bbbn = if bn == 1 then big else if xback then bn else bbbn[1];
def xbackbn = lastbn - bars_back + 1;

input show_vert_line = yes;
addverticalline(show_vert_line and xback, "-", color.cyan);

#---------------------------------------
# ref code
# rank the last 10 volume values
# https://usethinkscript.com/threads/rank-volume-1-10.9504/

input data = low;
def qty = bars_back;
def rank = fold i = 1 to qty
  with rankcounter = 1
  do if data > GetValue(data, i) then rankcounter + 1 else rankcounter;

def FinalBar_c = fold c = 0 to lastbn
  while !IsNaN(GetValue(close, -c))
  do c + bn;

def rank1 =  fold r = (0 - (lastbn - BarNumber() )) to qty - (lastbn - BarNumber())
  with rcounter = 1
  do if data > GetValue(data, r) then rcounter + 1 else rcounter;

def rngbar1 = lastbn - qty + 1;
def cntdwn_in_rng = lastbn - bn + 1;

# bn, countup thru the rng, 1st bar = 1 , last bar = qty
def cntup_in_rng = qty - cntdwn_in_rng + 1;
def rank2 = if bn >= rngbar1 then rank1 else 0;

# find dup #s and make an offset
def dup1 = fold g = 1 to qty
  with h
  do h + (if rank2 == getvalue(rank2, g) then 1 else 0);

# adjusted rank, add dup offset, all unique #s
def rank3 = if bn >= rngbar1 then (rank2 + dup1) else rank2;
# rank3 numbers, 1 = lowest price. 2 = 2nd lowest price,...

#-------------------------------------

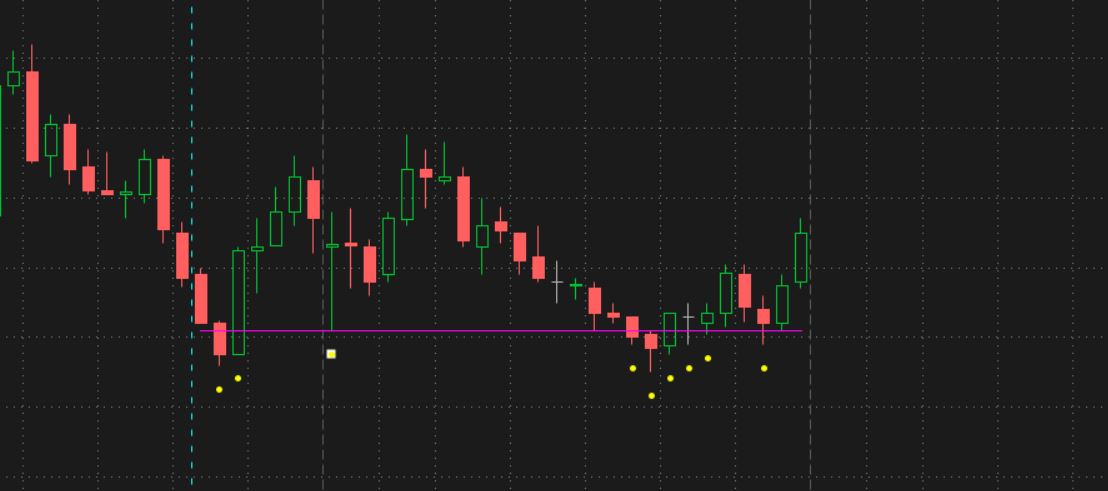
# plot dots under  lowest lows, a qty of rank3 numbers
input qty_of_lows = 4;
def lolo = (rank3 <= qty_of_lows) and (bn >= xbackbn);
def lolowest = (rank3 == qty_of_lows) and (bn >= xbackbn);
def vert2 = 0.001;
input show_low_dots = yes;

plot zl = if show_low_dots and lolo then low*(1-vert2) else na;
zl.SetPaintingStrategy(PaintingStrategy.points);
zl.SetDefaultColor(Color.yellow);
zl.setlineweight(2);
zl.hidebubble();


plot zl2 = if show_low_dots and lolowest then low*(1-vert2) else na;
zl2.SetPaintingStrategy(PaintingStrategy.squares);
zl2.SetDefaultColor(Color.white);
zl2.setlineweight(4);
zl2.hidebubble();

#--------------------

# find offset back to highest low
def f;
if bn == 1 or isnan(close) then {
 f = 0;
} else if lastbar then {
 f = fold j = 0 to bars_back 
  with q
  while getvalue(rank3, j) != qty_of_lows
  do q + 1;
} else {
 f = f[1];
}

# read low from highest low , in qty group 
def f2 = highestall( if lastbar then getvalue(data, f) else 0);
# plot horz line at xth qty

input show_horz_line_highest_low = yes;
plot hz = if show_horz_line_highest_low and (bn >= xbackbn) and !isnan(close) then f2 else na;
hz.setdefaultcolor(color.magenta);


#-------------------------------

input test3 = no;
addchartbubble(test3, low*0.994,
rank3 + "\n" +
f2 + "\n" +
qty_of_lows + "\n" +
xbackbn
, (if rank3 == qty_of_lows then color.yellow else color.gray), no);
#, color.yellow, no);

input test1 = no;
addchartbubble(test1, 0,
 bn + " bn\n" +
# finalbar + " f\n" +
 #e + " e\n" +
 finalbar_c + " c\n"
, color.yellow, yes);

input test_show_ranking_bubbles = no;
AddChartBubble(test_show_ranking_bubbles, high, rank1, color.gray, yes);
addchartbubble(test_show_ranking_bubbles and bn >= rngbar1, high, dup1 , (if dup1 > 0 then color.cyan else color.gray), yes);
addchartbubble(test_show_ranking_bubbles and bn >= rngbar1, high, rank3 , color.green, yes);

#------------------------------

#input test_ranked_data = no;
#addchartbubble(test_ranked_data and bn >= rngbar1, low*0.998,
# cntup_in_rng + "\n" +
# data_rank
# , color.yellow, no);


input test_rng_counts_data = no;
addchartbubble(test_rng_counts_data and bn >= rngbar1, low*0.998,
 bn + "\n" +
 data + " dat\n" +
 rngbar1 + "\n" +
 cntdwn_in_rng + "\n" +
 cntup_in_rng + "\n"
# +
 #data_rank
 , color.yellow, no);

#


PFE 15min
bars back = 33
qty of lows = 9
highest low has white square
nqYb6MF.jpg


ref , rank study
https://usethinkscript.com/threads/rank-volume-1-10.9504/
 

Join useThinkScript to post your question to a community of 21,000+ developers and traders.

Similar threads

Not the exact question you're looking for?

Start a new thread and receive assistance from our community.

87k+ Posts
443 Online
Create Post

Similar threads

Similar threads

The Market Trading Game Changer

Join 2,500+ subscribers inside the useThinkScript VIP Membership Club
  • Exclusive indicators
  • Proven strategies & setups
  • Private Discord community
  • ‘Buy The Dip’ signal alerts
  • Exclusive members-only content
  • Add-ons and resources
  • 1 full year of unlimited support

Frequently Asked Questions

What is useThinkScript?

useThinkScript is the #1 community of stock market investors using indicators and other tools to power their trading strategies. Traders of all skill levels use our forums to learn about scripting and indicators, help each other, and discover new ways to gain an edge in the markets.

How do I get started?

We get it. Our forum can be intimidating, if not overwhelming. With thousands of topics, tens of thousands of posts, our community has created an incredibly deep knowledge base for stock traders. No one can ever exhaust every resource provided on our site.

If you are new, or just looking for guidance, here are some helpful links to get you started.

What are the benefits of VIP Membership?
VIP members get exclusive access to these proven and tested premium indicators: Buy the Dip, Advanced Market Moves 2.0, Take Profit, and Volatility Trading Range. In addition, VIP members get access to over 50 VIP-only custom indicators, add-ons, and strategies, private VIP-only forums, private Discord channel to discuss trades and strategies in real-time, customer support, trade alerts, and much more. Learn all about VIP membership here.
How can I access the premium indicators?
To access the premium indicators, which are plug and play ready, sign up for VIP membership here.
Back
Top