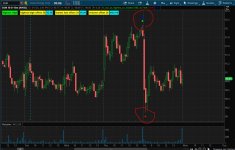
@BenTen I have Brain Shannon's AVWAP script which is very impressive. He has, as a part of the script, where it will automatically anchor a vwap to the "highest volume candle" on the chart. I have found that when that highest volume candle is also the lowest candle on the chart i.e. 1 year daily, 5 day 15 minute.... and holds above that low, there is a MASSIVE run to the upside. And visa versa on the highest candle on the chart.
I tried to do a indicator/scan to find those scenarios, but TOS says it is to complex (using Shannon's whole script).
Is there a way to make a scan that can find the highest volume on the lowest/highest candle on the chart?
Believe me, the results are VERY profitable.
Technically it doesn't repaint, it updates if they're is a new higher volume... but the strategy is when it is at the bottom, and the next candle/candles are above the vwap, (in the bullish scenario) it rips... and usually it doesn't post another high volume vwap for a LONG time. Plus it acts as a great support reverence for the move up for dip buys.
Last edited by a moderator: