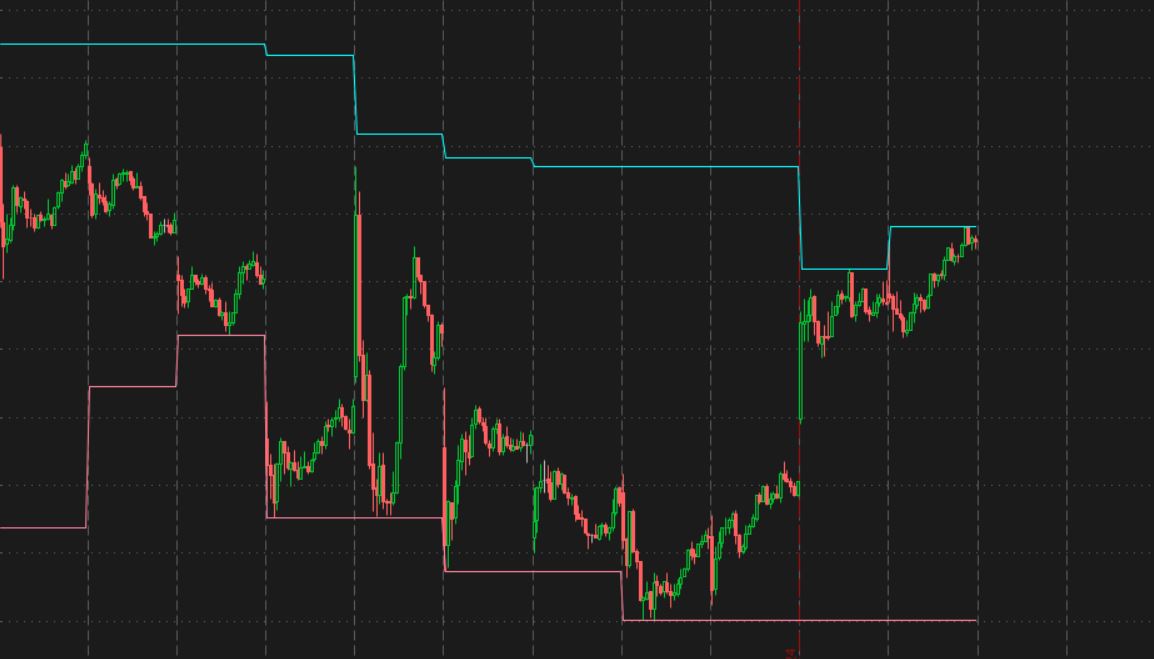
I am just looking for two horizontal lines to appear on my 15min timeframe chart:
Line 1 - Finds the highest high of the previous five days (or X days) and plots it on my 15 min chart
Line 2 - Finds the lowest low of the previous five days (or X days) and plots it on my 15 min chart
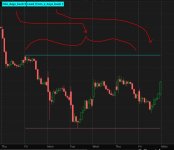
For whatever reason, it does not seem to work no matter what I try and I am sure it is very simple.
Maybe something to do with a higher timeframe?
Any thoughts?
Line 1 - Finds the highest high of the previous five days (or X days) and plots it on my 15 min chart
Line 2 - Finds the lowest low of the previous five days (or X days) and plots it on my 15 min chart
For whatever reason, it does not seem to work no matter what I try and I am sure it is very simple.
Maybe something to do with a higher timeframe?
Any thoughts?