Long Term Bollinger Band Breakout Strategy for ThinkorSwim

As promised here are my backtest results and the parameters I used for the backtesting.

Here is the test matrix
LengthExit conditionsTrade SizeRate of Change
Weekly3.5 ATRNone30%
Weekly3.5 ATR5%30%
Weekly3.5 ATRNone20%
Weekly3.5 ATR5%20%
WeeklyBollBand Lower CrossNone30%
WeeklyBollBand Lower Cross5%30%
WeeklyBollBand Lower CrossNone20%
WeeklyBollBand Lower Cross5%20%
Daily3.5 ATRNone30%
Daily3.5 ATR5%30%
Daily3.5 ATRNone20%
Daily3.5 ATR5%20%
DailyBollBand Lower CrossNone30%
DailyBollBand Lower Cross5%30%
DailyBollBand Lower CrossNone20%
DailyBollBand Lower Cross5%20%

I wanted to know what combination of settings would yield a better-expected outcome over a long period while still staying reasonably faithful to the original strategy. I am not going to post the results of all the backtests it would just take to much time, and I already spent enough developing the testing.

First, we will start the purest form of the strategy, and then I will take you through some of the other factors listed above.
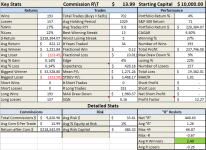
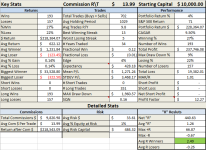
Weekly Bollinger Band Cross with 5% position size and a Rate of Change of 30%
This strategy does not fire off that often also the reduction of trades due to the position sizing not allowing trades to be made above the 5% threshold of the capital. Some notable stats are the Max Drawdown of less than 13% and the low losing %.

us0ep54.png


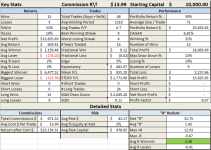
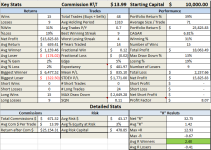
Next sticking to the weekly stats we will change the ROC to 20% which helps to produce more trades and a better expectancy. I went full hog on this setup and tested it against the entire S&P100 I did this work by hand, so I devoted my time to the higher potential settings.

Some notable stats are the CAGAR upwards of 9.5% a whole 3 points higher than the regular strat and a slightly better max drawdown.

4RS9bbs.png


Adding the 3.5 ATR stop reduced the compound annual growth rate to nearly 0%. It nullifies your edge by getting you out of the trades a little too early.

TLDR:
Best settings I have found so far with testing the strategy over 100 individual stocks and 34 years simulated are:
Bollinger Band Upper 2, Lower -1 Rate of Change 20% and fixed position sizing. These results would be much more accurate if I was able to scale the testing portfolio in think or swim but due to the backtesting limitation in TOS it is a fixed position size not taking into account any compound gains in the portfolio.

I am currently working on testing the strategy on the daily time frame, but so far, the weekly settings are wining in comparison.
 

Attachments

  • us0ep54.png
    us0ep54.png
    61.7 KB · Views: 217
  • 4RS9bbs.png
    4RS9bbs.png
    62.8 KB · Views: 222

Join useThinkScript to post your question to a community of 21,000+ developers and traders.

Thank you for posting this, I agree there needs to be more wiggle room on the are stops so they can perform, especially on a longer term system like this- how hard would it be on thinkorswim to change it to the regime filter 20% / 10% trailing stop, asking as a non-coder. Also, I didn’t know you could backtest a portfolio at all on thinkorswim- pleasantly surprised to hear..couldn’t find anything but ‘onDemand’, still though, i think in the long run for backttesting dedicated software may be in order. i hear amibroker is a good product.
 
@tibby42 Next step is adding the more advanced regime filter and posting the updated code. Stay tuned.

TOS does not have the ability to backtest a portfolio. These are individual backtests that I sorted and applied some stats too for convenience only. TOS is missing a lot of components specifically the ability to manage the capital usage and tracking capital over the lifetime of the backtest. Therefore allocations in these backtests are based on 5% of the $10,000 starting portfolio over the lifetime of the test. This eliminates the benefits of compounding and additional profits from dividends etc.
 
@Zachc , Thank you so much for all the time and effort you put into this! Can't wait to utilize the script but for some reason after adding to my scripts I'm not seeing it there when I try to add it in my studies? I've never experienced this before and just wondering if anyone else has had this issue or has any insight on this? Thanks in advance!
 
As promised here are my backtest results and the parameters I used for the backtesting.

Here is the test matrix
LengthExit conditionsTrade SizeRate of Change
Weekly3.5 ATRNone30%
Weekly3.5 ATR5%30%
Weekly3.5 ATRNone20%
Weekly3.5 ATR5%20%
WeeklyBollBand Lower CrossNone30%
WeeklyBollBand Lower Cross5%30%
WeeklyBollBand Lower CrossNone20%
WeeklyBollBand Lower Cross5%20%
Daily3.5 ATRNone30%
Daily3.5 ATR5%30%
Daily3.5 ATRNone20%
Daily3.5 ATR5%20%
DailyBollBand Lower CrossNone30%
DailyBollBand Lower Cross5%30%
DailyBollBand Lower CrossNone20%
DailyBollBand Lower Cross5%20%

I wanted to know what combination of settings would yield a better-expected outcome over a long period while still staying reasonably faithful to the original strategy. I am not going to post the results of all the backtests it would just take to much time, and I already spent enough developing the testing.

First, we will start the purest form of the strategy, and then I will take you through some of the other factors listed above.
Weekly Bollinger Band Cross with 5% position size and a Rate of Change of 30%
This strategy does not fire off that often also the reduction of trades due to the position sizing not allowing trades to be made above the 5% threshold of the capital. Some notable stats are the Max Drawdown of less than 13% and the low losing %.

us0ep54.png


Next sticking to the weekly stats we will change the ROC to 20% which helps to produce more trades and a better expectancy. I went full hog on this setup and tested it against the entire S&P100 I did this work by hand, so I devoted my time to the higher potential settings.

Some notable stats are the CAGAR upwards of 9.5% a whole 3 points higher than the regular strat and a slightly better max drawdown.

4RS9bbs.png


Adding the 3.5 ATR stop reduced the compound annual growth rate to nearly 0%. It nullifies your edge by getting you out of the trades a little too early.

TLDR:
Best settings I have found so far with testing the strategy over 100 individual stocks and 34 years simulated are:
Bollinger Band Upper 2, Lower -1 Rate of Change 20% and fixed position sizing. These results would be much more accurate if I was able to scale the testing portfolio in think or swim but due to the backtesting limitation in TOS it is a fixed position size not taking into account any compound gains in the portfolio.

I am currently working on testing the strategy on the daily time frame, but so far, the weekly settings are wining in comparison.

@Zackc - Added an SPX greater than 200 SMA filter and used 20% of equity. Note the max draw-down, most could not handle. Also did not perform well over the last four years @ -9%, +2%, -9% and +3% YTD 2019

All TradesLong TradesShort TradesBenchmark Buy & Hold (SPX)
Starting Capital
$25,000.00​
$25,000.00​
$25,000.00​
$25,000.00​
Ending Capital
$1,062,377.55​
$1,062,377.55​
$25,000.00​
$193,864.41​
Net Profit
$1,037,377.55​
$1,037,377.55​
$0.00​
$168,864.41​
Net Profit %
4149.51%​
4149.51%​
0.00%​
675.46%​
Annualized Gain %
14.45%​
14.45%​
0.00%​
7.65%​
Exposure
36.10%​
36.10%​
0.00%​
99.76%​
Total Commission
($821.70)​
($821.70)​
$0.00​
($4.95)​
Return on Cash
$0.00​
$0.00​
$0.00​
$0.00​
Margin Interest Paid
$0.00​
$0.00​
$0.00​
$0.00​
Dividends Received
$0.00​
$0.00​
$0.00​
$0.00​
Number of Trades
84​
84​
0​
1​
Average Profit
$12,349.73​
$12,349.73​
$0.00​
$168,864.41​
Average Profit %
27.90%​
27.90%​
0.00%​
681.15%​
Average Bars Held
144.26​
144.26​
0​
6,995.00​
Winning Trades
43​
43​
0​
1​
Win Rate
51.19%​
51.19%​
0.00%​
100.00%​
Gross Profit
$1,667,855.70​
$1,667,855.70​
$0.00​
$168,864.41​
Average Profit
$38,787.34​
$38,787.34​
$0.00​
$168,864.41​
Average Profit %
68.27%​
68.27%​
0.00%​
681.15%​
Average Bars Held
215.07​
215.07​
0​
6,995.00​
Max Consecutive Winners
7​
7​
0​
1​
Losing Trades
41​
41​
0​
0​
Loss Rate
48.81%​
48.81%​
0.00%​
0.00%​
Gross Loss
($630,478.15)​
($630,478.15)​
$0.00​
$0.00​
Average Loss
($15,377.52)​
($15,377.52)​
$0.00​
$0.00​
Average Loss %
-14.43%​
-14.43%​
0.00%​
0.00%​
Average Bars Held
70​
70​
0​
0​
Max Consecutive Losses
8​
8​
0​
0​
Maximum Drawdown
($305,708.84)​
($305,708.84)​
$0.00​
($57,760.31)​
Maximum Drawdown Date
6/24/2013​
6/24/2013​
12/2/1991​
3/9/2009​
Maximum Drawdown %
-50.70%​
-50.70%​
0.00%​
-56.66%​
Maximum Drawdown % Date
4/17/2000​
4/17/2000​
9/11/2019​
3/9/2009​
Wealth-Lab Score
19.74​
19.74​
0​
3.33​
Sharpe Ratio
0.67​
0.67​
0​
0.6​
Profit Factor
2.65​
2.65​
0​
Recovery Factor
3.39​
3.39​
0​
2.92​
Payoff Ratio
4.73​
4.73​
0​
0​
Profit / Total Bars
$148.28​
$148.28​
$0.00​
$24.14​


Attachments

  • us0ep54.png
    us0ep54.png
    61.7 KB · Views: 205
  • 4RS9bbs.png
    4RS9bbs.png
    62.8 KB · Views: 205
@Zachc Great work Zach! I was reading Nick Radge's books recently and was looking for the "Weekend trend trader" strategy, did you test this one also as I see you have taken some elements from it like the Rate of Change part?
 
@Zachc Great work Zach! I was reading Nick Radge's books recently and was looking for the "Weekend trend trader" strategy, did you test this one also as I see you have taken some elements from it like the Rate of Change part?
@Zachc , I hope you don't mind, I atempted to tweak your code over the weekend to match the "weekend trend trader" strategy and posted it separately here
Weekend trend trader strategy
 
@Zachc Thanks for putting the work in on Nick Radge's study. This is a quality posting!
I follow him on Twitter and get his newsletter.
An excellent person for anyone to learn Trend Following from!


Hello Zachc. wonderful work with this strategy. I am not a coder so I need some clarification. I noticed that with the version for long orders you corrected for the orders to execute at open[-1] but with the short orders version you have open[1] and wondered if it is supposed to be open[-1] as well or is it intentional for it to be open[1]. I was thinking that with the nature of short orders maybe it was intentional because one may want it to be open[1] so it executes right away without waiting for the open or become a swing trade, but then this is a long term strategy so it could be a short term multiple days swing. Please clarify. Thanks
 
Last edited:
You are correct it should be a -1 since we are testing for our strategy on the close we should be opening the new order on open the following day. I just checked my code and I have it set to -1 I must have fixed it without thinking about it a while ago. I have corrected the code and provided a new link just in case that version was also wrong.
 
You are correct it should be a -1 since we are testing for our strategy on the close we should be opening the new order on open the following day. I just checked my code and I have it set to -1 I must have fixed it without thinking about it a while ago. I have corrected the code and provided a new link just in case that version was also wrong.

I had a feeling it needed to be the same. Thanks for the update.
 
Help me out guys. Newbie here. So bascially you are using this code just to back test right? The way this would work is that I would use the scans at the end of the week (after close on Friday) and see what candidates show in the list and I would place the order manually to be executed on Monday at the open, right? And I would have to monitor this live each EOW? or what? lol sorry and Thanks.
 
@giorgio ThinkorSwim will not automatically buy and sell for you. So this is only useful for backtesting. You would still have to execute the order at your end.
 
Hello Zack, Thank you for all your hard work with this strategy. I hope you don’t take offense, I am trying to tweak a little the buy and sell order in the Nick Radge Breakout strategy that you posted
https://usethinkscript.com/threads/long-term-bollinger-band-breakout-strategy-for-thinkorswim.451/
to test for monthlies or LEAPS and need help because I am terrible with trails stops and they knock me out of my trades, so I took out the trail stop and want to add a simple exit strategy. Thanks to learning from you all I can do a little to state some of the conditions with thinkscript but I don’t know how to do it completely. I piece together how to say the main condition but don’t know how to say AND ONE OF THESE for a choice of the other conditions if they occur. Also, is the input displace the 10 cents amount above the entry signal and is it the $50 decrease maximum from entry stop loss or do I put these as the offset amounts in TOS? How do I say above EMA BY $0.10 for entry? For #stoploss how to say Sell if price decreases maximum $50 or no more than 3% from entry? And for these in the script do I add:
input entrydisplace = $0.10;
input stoploss displace = $50;

This is what I’m trying to say:

Buy if price does a higher high above (bbMidline) EMA35 by $0.10 and EMA35 is above EMA100

Sell if price does a lower low below (bbMidline) EMA35 by $0.10 and bbMidline is below Ema100
AND ONE OF THESE
  • HIGH DECREASES LESS THAN $50 OR NO MORE THAN 3% FROM ENTRY #Stoploss
  • price decreases 2% maximum from last price #Profit
  • volume is greater than volume of the previous candle
This is what I have so far:
AddOrder(condition = buySignal, type = OrderType.BUY_TO_OPEN, price = open, name = "bbBreak_LE");
AddOrder(condition = bbBreakDown, type = OrderType.SELL_TO_CLOSE, price = open, name = "bbBreak_LX");

AddOrder(OrderType.BUY_TO_OPEN, high is greater than high from 1 bars ago and high is greater than MovAvgExponential("length" = 35)."AvgExp" BY $0.10 and ONE OF THESE MovAvgExponential("length" = 35)."AvgExp" is greater than MovAvgExponential("length" = 100)."AvgExp", or high is greater than vwap, or volume is greater than volume from 1 bars ago, tickColor = GetColor(9), arrowColor = GetColor(1));
#
AddOrder(OrderType.SELL_TO_CLOSE, high is less than high from 1 bars ago and high is less than MovAvgExponential("length" = 35)."AvgExp" BY $0.10 and ONE OF THESE MovAvgExponential("length" = 35)."AvgExp" is less than MovAvgExponential("length" = 100)."AvgExp", or high is less than vwap, or volume is less than volume from 1 bars ago, OR HIGH DECREASES LESS THAN $50 OR NO MORE THAN 3% MAXIMUM FROM ENTRY, tickColor = GetColor(9), arrowColor = GetColor(1));
 
Last edited:
Hey everyone!
Im fairly new to the whole TOS platform and thinkscript in general.
I built a strategy using the conditional wizard and i want to use this strategy as a condition in a new strategy. So far i have found no way to use a study as a condition.

The main strategy is true once all conditions have been met:
1) 5 bars closed over BB with dev of 0.382
2) short pivot high was found in or after those bars ( high, higher high, lower high).

The code for the main Study is as follows:
Code:
close is greater than or equal to BollingerBands("num dev dn" = -0.382, "num dev up" = 0.382)."UpperBand"
and close from 1 bars ago is greater than or equal to BollingerBands("num dev dn" = -0.382, "num dev up" = 0.382)."UpperBand" from 1 bars ago
and close from 2 bars ago is greater than or equal to BollingerBands("num dev dn" = -0.382, "num dev up" = 0.382)."UpperBand" from 2 bars ago
and close from 3 bars ago is greater than or equal to BollingerBands("num dev dn" = -0.382, "num dev up" = 0.382)."UpperBand" from 3 bars ago
and close from 4 bars ago is greater than or equal to BollingerBands("num dev dn" = -0.382, "num dev up" = 0.382)."UpperBand" from 4 bars ago
and high is less than high from 1 bars ago and high from 1 bars ago is greater than high from 2 bars ago

(I cant seem to upload an image, so for the sake of simplicity im adding this image url)

YcaKdXi.png


As can be seen by the image, the study works well to find the conditions. (Bar #2 met all conditions, while bar #1 is the high of the last conditions in the study)

What I am wishing to do is have another study that will alert when the next X bars after go over the high bar before that triggered the study (bar #1). So in this case bar #4 reaches higher than bar #1 (only after Study1 is triggered) and this should alert in the new study.

I hope I was able to be clear with the explanation and apologies for the image that wouldn't upload.

Thanks for the help!
 
How do we add audios, text alerts for this? @BenTen
I have come up this one by one of yours alert.
Could you guide/help me in good direction?

#Alert(BuySignal, " ", Alert.Bar, Sound.Bell);
#Alert(SellSignal, " ", Alert.Bar, Sound.Chimes);
#This's for long position.

Alert(bbBreak_LE, " ", Alert.Bar, Sound.Bell);
Alert(TrailStop " ", Alert.Bar, Sound.Chimes);
Alert(bbBreak_LX, " ", Alert.Bar, Sound.Chimes);

#This's for short position.
#opposite go for short version?

Alert(bbBreak_SE, " ", Alert.Bar, Sound.Bell);
Alert(TrailStop " ", Alert.Bar, Sound.Chimes);
Alert(bbBreak_SE, " ", Alert.Bar, Sound.Chimes);
 
Last edited:
Would someone please show the final code for this indicator, I know there has been many updates written so far. Thanks in advance trade seeker.
 

Not the exact question you're looking for?

Start a new thread and receive assistance from our community.

87k+ Posts
300 Online
Create Post

The Market Trading Game Changer

Join 2,500+ subscribers inside the useThinkScript VIP Membership Club
  • Exclusive indicators
  • Proven strategies & setups
  • Private Discord community
  • ‘Buy The Dip’ signal alerts
  • Exclusive members-only content
  • Add-ons and resources
  • 1 full year of unlimited support

Frequently Asked Questions

What is useThinkScript?

useThinkScript is the #1 community of stock market investors using indicators and other tools to power their trading strategies. Traders of all skill levels use our forums to learn about scripting and indicators, help each other, and discover new ways to gain an edge in the markets.

How do I get started?

We get it. Our forum can be intimidating, if not overwhelming. With thousands of topics, tens of thousands of posts, our community has created an incredibly deep knowledge base for stock traders. No one can ever exhaust every resource provided on our site.

If you are new, or just looking for guidance, here are some helpful links to get you started.

What are the benefits of VIP Membership?
VIP members get exclusive access to these proven and tested premium indicators: Buy the Dip, Advanced Market Moves 2.0, Take Profit, and Volatility Trading Range. In addition, VIP members get access to over 50 VIP-only custom indicators, add-ons, and strategies, private VIP-only forums, private Discord channel to discuss trades and strategies in real-time, customer support, trade alerts, and much more. Learn all about VIP membership here.
How can I access the premium indicators?
To access the premium indicators, which are plug and play ready, sign up for VIP membership here.
Back
Top