As promised here are my backtest results and the parameters I used for the backtesting.
Here is the test matrix
I wanted to know what combination of settings would yield a better-expected outcome over a long period while still staying reasonably faithful to the original strategy. I am not going to post the results of all the backtests it would just take to much time, and I already spent enough developing the testing.
First, we will start the purest form of the strategy, and then I will take you through some of the other factors listed above.
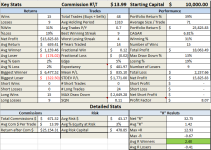
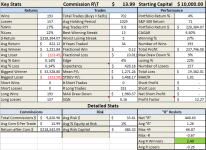
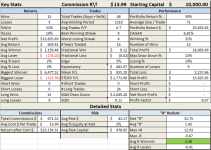
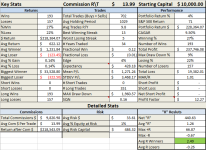
Weekly Bollinger Band Cross with 5% position size and a Rate of Change of 30%
This strategy does not fire off that often also the reduction of trades due to the position sizing not allowing trades to be made above the 5% threshold of the capital. Some notable stats are the Max Drawdown of less than 13% and the low losing %.

Next sticking to the weekly stats we will change the ROC to 20% which helps to produce more trades and a better expectancy. I went full hog on this setup and tested it against the entire S&P100 I did this work by hand, so I devoted my time to the higher potential settings.
Some notable stats are the CAGAR upwards of 9.5% a whole 3 points higher than the regular strat and a slightly better max drawdown.

Adding the 3.5 ATR stop reduced the compound annual growth rate to nearly 0%. It nullifies your edge by getting you out of the trades a little too early.
TLDR:
Best settings I have found so far with testing the strategy over 100 individual stocks and 34 years simulated are:
Bollinger Band Upper 2, Lower -1 Rate of Change 20% and fixed position sizing. These results would be much more accurate if I was able to scale the testing portfolio in think or swim but due to the backtesting limitation in TOS it is a fixed position size not taking into account any compound gains in the portfolio.
I am currently working on testing the strategy on the daily time frame, but so far, the weekly settings are wining in comparison.
Here is the test matrix
| Length | Exit conditions | Trade Size | Rate of Change |
| Weekly | 3.5 ATR | None | 30% |
| Weekly | 3.5 ATR | 5% | 30% |
| Weekly | 3.5 ATR | None | 20% |
| Weekly | 3.5 ATR | 5% | 20% |
| Weekly | BollBand Lower Cross | None | 30% |
| Weekly | BollBand Lower Cross | 5% | 30% |
| Weekly | BollBand Lower Cross | None | 20% |
| Weekly | BollBand Lower Cross | 5% | 20% |
| Daily | 3.5 ATR | None | 30% |
| Daily | 3.5 ATR | 5% | 30% |
| Daily | 3.5 ATR | None | 20% |
| Daily | 3.5 ATR | 5% | 20% |
| Daily | BollBand Lower Cross | None | 30% |
| Daily | BollBand Lower Cross | 5% | 30% |
| Daily | BollBand Lower Cross | None | 20% |
| Daily | BollBand Lower Cross | 5% | 20% |
I wanted to know what combination of settings would yield a better-expected outcome over a long period while still staying reasonably faithful to the original strategy. I am not going to post the results of all the backtests it would just take to much time, and I already spent enough developing the testing.
First, we will start the purest form of the strategy, and then I will take you through some of the other factors listed above.
Weekly Bollinger Band Cross with 5% position size and a Rate of Change of 30%
This strategy does not fire off that often also the reduction of trades due to the position sizing not allowing trades to be made above the 5% threshold of the capital. Some notable stats are the Max Drawdown of less than 13% and the low losing %.
Next sticking to the weekly stats we will change the ROC to 20% which helps to produce more trades and a better expectancy. I went full hog on this setup and tested it against the entire S&P100 I did this work by hand, so I devoted my time to the higher potential settings.
Some notable stats are the CAGAR upwards of 9.5% a whole 3 points higher than the regular strat and a slightly better max drawdown.
Adding the 3.5 ATR stop reduced the compound annual growth rate to nearly 0%. It nullifies your edge by getting you out of the trades a little too early.
TLDR:
Best settings I have found so far with testing the strategy over 100 individual stocks and 34 years simulated are:
Bollinger Band Upper 2, Lower -1 Rate of Change 20% and fixed position sizing. These results would be much more accurate if I was able to scale the testing portfolio in think or swim but due to the backtesting limitation in TOS it is a fixed position size not taking into account any compound gains in the portfolio.
I am currently working on testing the strategy on the daily time frame, but so far, the weekly settings are wining in comparison.


