I am always looking for a nice long term system that is adept at entering into long term trends. I don't have time for day trading or even swing trading for that matter.
I was listening to the ChatwithTraders podcast which I highly recommend to anyone that has not listened to check out the huge back catalog Aaron has encompassing every market trading strategy and mindset you can think of. This month's episode is with Nick Radge which they took the time to outline Nick's process on building trading strategies which were very enlighting for a novice.
Nick outlined a simple trend-following the strategy he developed backtested and published years ago in his book Unholy grails he uses in his retirement portfolio. The strategy is long-only and is perfect for a long term set it and forget it type of strategy. Which would be perfect for my 2-year-old daughters UTMA account.
Anyways TLDR: I made a video for everyone explaining the strategy and showing some example trades.
Strategy Parameters
https://tos.mx/nL28ZR
BollBand_Short Breakout
https://tos.mx/EadCK8
Weekly Scan for new positions
https://tos.mx/jTYMAq
Daily Scan for new positions
https://tos.mx/YZXOS6

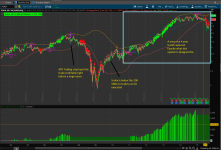
Typo on exactly in the image ugh.

I was listening to the ChatwithTraders podcast which I highly recommend to anyone that has not listened to check out the huge back catalog Aaron has encompassing every market trading strategy and mindset you can think of. This month's episode is with Nick Radge which they took the time to outline Nick's process on building trading strategies which were very enlighting for a novice.
Nick outlined a simple trend-following the strategy he developed backtested and published years ago in his book Unholy grails he uses in his retirement portfolio. The strategy is long-only and is perfect for a long term set it and forget it type of strategy. Which would be perfect for my 2-year-old daughters UTMA account.
Anyways TLDR: I made a video for everyone explaining the strategy and showing some example trades.
Strategy Parameters
- This is a long-only strategy
- Buy and Sell the day after the signal at the open
- Regime filter used to halt trading when the index is below the 200 SMA
- Rate of change filters out any moves that are less than 10% looking back 20 periods
- Added an ATR Trailing Stop to weed out the bigger losses due to the BBands expanding really wide during large trends
- Weekly Time Frame
- 100 Period
- Upper band 2 stdv
- Lower band -1 stdv
- SMA Average
https://tos.mx/nL28ZR
BollBand_Short Breakout
https://tos.mx/EadCK8
Weekly Scan for new positions
https://tos.mx/jTYMAq
Daily Scan for new positions
https://tos.mx/YZXOS6
Typo on exactly in the image ugh.
Code:
##Nick Radge Bollinger Band Breakout Strat
##
##Basic Strategy used on a Daily, Weekly, Monthly timeframe.
# 1) Bollinger bands Period 100 days
# 2) Boll bands set to 2 standard deviation
# 3) Buy on the open day after the signal
# 4) Bottom Bollinger band set to -1 stdv
# 6) Sell when price closes below this level on the following day
# 7) Use a regime filter to gague the overall market sentimate
#    Gaged by the 200day MA on then index that you can select from the drop down.  SPX is default.

declare hide_on_intraday;
input roc = 20;
input bbPeriod = 100;
input bbUpper = 2;
input bbLower = -1;
input bbAvg = AverageType.SIMPLE;
input market = {default SPX, NDX, RUT, DJX};
Input Market_200Day_MA = 40;

## Indicator
def bbBreakUp = close > BollingerBands(close, length = bbPeriod, "num dev up" = bbUpper, "average type" = bbAvg, "num dev dn" = bbLower).UpperBand;
def bbBreakDown = close < BollingerBands(price = open, length = bbPeriod, "num dev dn" = bbLower, "num dev up" = bbUpper, "average type" = bbAvg).LowerBand;

## Regime Filter
#Is the market this stock is apart of above the 200 day MA
#8/13/19 Updated to 40 periods for the weekly time frame as the default credit mc01439

def length = Market_200Day_MA;
def RF = SimpleMovingAvg(close(symbol = market), length);

plot closeMA = close(symbol = market) < RF;

def marClose = close(market);
AddLabel(1, Concat("Index: ", Concat(market, Concat(" " + marClose, " 200SMA= " + RF))), if marClose > RF
  then Color.GREEN
  else Color.RED);

## Confirmation rate of change
def rate = RateOfChange(roc);

########################################################################
## Trailing Stop

input trailType = {default modified, unmodified};
input ATRPeriod = 5;
input ATRFactor = 3.5;
input firstTrade = {default long, short};

assert(ATRFactor > 0, "'atr factor' must be positive: " + ATRFactor);

def HiLo = Min(high - low, 1.5 * Average(high - low, ATRPeriod));
def HRef = if low <= high[1]
  then high - close[1]
  else (high - close[1]) - 0.5 * (low - high[1]);
def LRef = if high >= low[1]
  then close[1] - low
  else (close[1] - low) - 0.5 * (low[1] - high);
def ATRMod = ExpAverage(Max(HiLo, Max(HRef, LRef)), 2 * ATRPeriod - 1);
def loss = ATRFactor * ATRMod;
#  case unmodified:
#    loss = ATRFactor * ATR(high, close, low, ATRPeriod);


def state = {default init, long, short};
def trail;

switch (state[1]) {
  case init:
    if (!IsNaN(loss)) {
      switch (firstTrade) {
        case long:
          state = state.long;
          trail =  close - loss;
        case short:
          state = state.short;
          trail = close + loss;
      }
    } else {
      state = state.init;
      trail = Double.NaN;
    }

  case long:
    if (close > trail[1]) {
      state = state.long;
      trail = Max(trail[1], close - loss);
    } else {
      state = state.short;
      trail = close + loss;
    }
  case short:
    if (close < trail[1]) {
      state = state.short;
      trail = Min(trail[1], close + loss);
    } else {
      state = state.long;
      trail =  close - loss;
    }
}

plot TrailingStop = trail;
TrailingStop.SetPaintingStrategy(PaintingStrategy.POINTS);
TrailingStop.DefineColor("Buy", GetColor(0));
TrailingStop.DefineColor("Sell", GetColor(1));
TrailingStop.AssignValueColor(if state == state.long
  then TrailingStop.color("Sell")
  else TrailingStop.color("Buy"));

plot cross = close crosses below trailingstop;
cross.setPaintingStrategy(paintingStrategy.BOOLEAN_ARROW_DOWN);
#end


###Plots###
plot upper = BollingerBands(close, length = bbPeriod, "num dev up" = bbUpper, "average type" = bbAvg, "num dev dn" = bbLower).UpperBand;
plot lower = BollingerBands(close, length = bbPeriod, "num dev up" = bbLower, "average type" = bbAvg, "num dev dn" = bbLower).LowerBand;
plot buySignal = bbBreakUp and rate > 10 and marClose > RF;
    buySignal.SetpaintingStrategy(PaintingStrategy.BOOLEAN_ARROW_UP);
    buySignal.SetLineWeight(2);
    buySignal.SetDefaultColor(Color.GREEN);
plot sellSignal = bbBreakDown;
    sellSignal.SetpaintingStrategy(PaintingStrategy.BOOLEAN_ARROW_Down);
    sellSignal.SetLineWeight(2);
    sellSignal.SetDefaultColor(Color.Red);

### Order Entry ###
#8/13/19 changed the index to [-1] on the open variable to ensure the order is placed on the open of the following day credit: mc01439

AddOrder(condition = buySignal, type = OrderType.BUY_TO_OPEN, price = open[-1], name = "bbBreak_LE");
AddOrder(condition = bbBreakDown, type = OrderType.SELL_TO_CLOSE, price = open[-1], name = "bbBreak_LX");
AddOrder(condition = cross, type = OrderType.SELL_TO_CLOSE, price = open[-1], name = "TrailStop");
Last edited: