

Larry Williams "Pro-Go" Indicator for ThinkorSwim

BenTen

Administrative
Staff member
Staff
VIP
Lifetime
mod note:
Here’s why Pro‑Go matters:
» When hedge funds / institutions pressure dominates→ traditional indicators behave as expected.​
» With retail pressure→ volatility rises, but with intent.​

Knowing who’s in control tells you whether:
✦ to trust the traditional indicators written to detect institutional movement.​
OR
✦ switch to pure price‑action management because retail is driving the move.​
Pro‑Go doesn’t tell you what price did — it tells you who did it, and that’s the edge.

The other half of this strategy as well as how to use it, can be found:
https://usethinkscript.com/threads/...moving-average-crossover-for-thinkorswim.792/


This script is based on the Pro-Go indicator that Larry Williams came up with.
The formula is fairly simple.
Close - Open = Professionals
Previous' Close - Open = Novices

He then averages out with a simple moving average (length of 14).
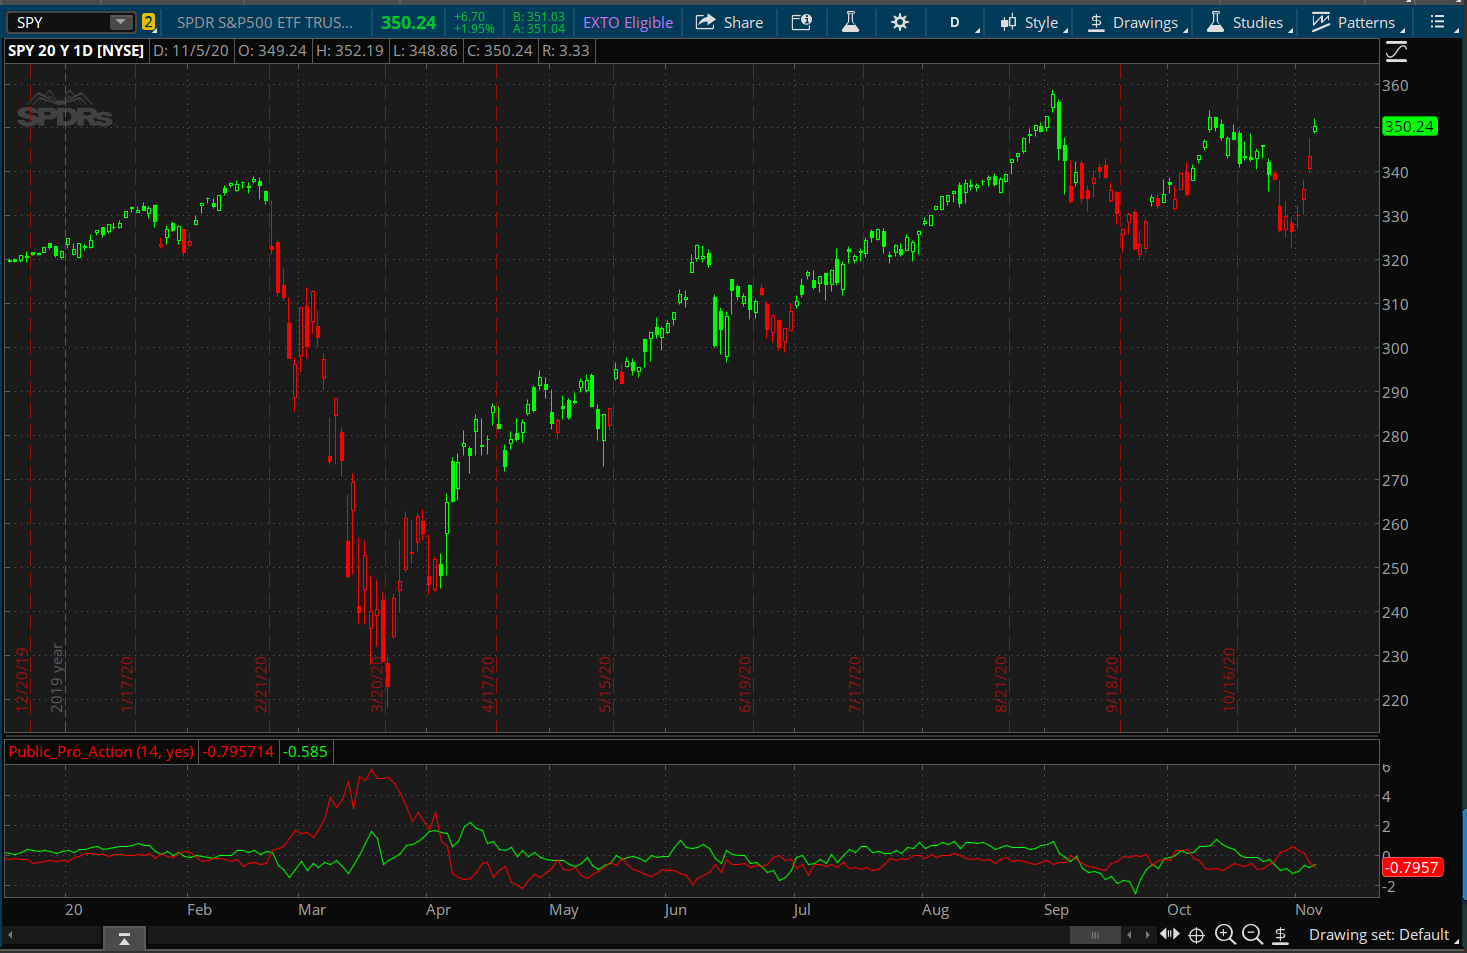
T2yhp2o.png


Code:
# Larry Williams Pro-Go
# Assembled by BenTen at UseThinkScript.com
# Converted from https://www.tradingview.com/script/R9iKLUAp-Public-Pro-Action/

declare lower;

input averageLength = 14;
input paintbar = no;

def public = close[1] - open;
def pro =  close - open;

def avg_public = simpleMovingAvg(public, averageLength);
def avg_pro = simpleMovingAvg(pro, averageLength);
def res = avg_pro - avg_public;
def priceSMA = simpleMovingAvg(close, averageLength);

plot pu = avg_public;
plot pr = avg_pro;

pu.AssignValueColor(color.red);
pr.AssignValueColor(color.green);

def condition1 = pu > pr;

assignPriceColor(if paintbar and condition1 then color.red else if paintbar and !condition1 then color.green else color.current);

Credit: bharatTrader
 
Last edited by a moderator:
@barbaros Good point. I'm not sure either. I just converted it from the original code on TradingView.
 
@barbaros Good point. I'm not sure either. I just converted it from the original code on TradingView.
Here is my attempt...

Python:
# Larry Williams Pro-Go
# Assembled by BenTen at UseThinkScript.com
# Updated by Barbaros 20201105
# Converted from https://www.tradingview.com/script/R9iKLUAp-Public-Pro-Action/

declare lower;

input averageLength = 14;
input advancedMode = yes;
input paintBars = yes;

def public = close[1] - open;
def pro =  close - open;

def avg_public = SimpleMovingAvg(public, averageLength);
def avg_pro = SimpleMovingAvg(pro, averageLength);
def res = avg_pro - avg_public;
def priceSMA = SimpleMovingAvg(close, averageLength);

plot public_val = if advancedMode then avg_public else Double.NaN;
public_val.setDefaultColor(color.red);

plot pro_val = if advancedMode then avg_pro else Double.NaN;
pro_val.setDefaultColor(color.green);

plot advanced_val = if !advancedMode then res else Double.NaN;
advanced_val.setPaintingStrategy(PaintingStrategy.HISTOGRAM);
advanced_val.assignValueColor(
    if close > priceSMA and res > 0 then color.green
    else if close < priceSMA and res < 0 then color.red
    else color.gray
);

AssignPriceColor(
    if paintBars and close > priceSMA and res > 0 then color.green
    else if paintBars and close < priceSMA and res < 0 then color.red
    else if paintBars then color.gray
    else color.CURRENT
);

Advanced:

9WZRxjQ.png


Not so advanced:
HAogcyS.png


WEgtId8.png
 
Last edited by a moderator:
Larry Williams has a professional vs public buying called ProGo. Would anyone be able to convert the TradeStation code ?
 
Last edited by a moderator:
@anty Here you go.

Code:
#Larry Williams Pro Go
#coded by DVRL, Optntdr13, daryanlenzatgmaildotcom from tradestation code
#Copyright Optntdr13, all rights reserved.
#V1:  02/19/2011
#
#
#


declare lower;
#hint Length: Number of periods to average the data.
Input Length = 14;
input movingAverageType = {default "Simple MA", "Exponential MA", "Wilders Smoothing", "Weighted MA", "Hull MA", "Adaptive MA", "Triangular MA", "Variable MA", "Dema MA", "Tema MA"};
input displace = 0;


def Pros = Close - Open;
def Public = Close[1] - Open;


plot X;                 
plot Y;
switch (movingAverageType)  {
case "Simple MA":
 X = Average(Pros[-displace],Length);
 Y = Average(Public[-displace],Length);
case "Exponential MA":
  X = ExpAverage(Pros[-displace], Length);
  Y = ExpAverage(Public[-displace],Length);
case "Wilders Smoothing":
  X = wildersSmoothing(Pros[-displace], Length);
  Y = WildersAverage(Public[-displace],Length);
case "Weighted MA":
 X = wma(Pros[-displace], Length);
 Y = wma(Public[-displace],Length);
case "Hull MA":
 X = hullMovingAvg(Pros[-displace], Length);
 Y = hullMovingAvg(Public[-displace],Length);
case "Adaptive MA":
 X = MovAvgAdaptive(Pros[-displace], Length);
 Y = MovAvgAdaptive(Public[-displace],Length);
case "Triangular MA":
 X = MovAvgTriangular(Pros[-displace], Length);
 Y = MovAvgTriangular(Public[-displace],Length);
case "Variable MA":
 X = VariableMA(Pros[-displace], Length);
 Y = VariableMA(Public[-displace],Length);
case "Dema MA":
 X = DEMA(Pros[-displace], Length);
 Y = DEMA(Public[-displace],Length);
case "Tema MA":
 X = Tema(Pros[-displace], Length);
 Y = Tema(Public[-displace],Length);
}

x.SetDefaultColor(CreateColor(188, 0, 240));
y.SetDefaultColor(CreateColor(29,239,255));
def ProsBuying = if x > y then x else y;
def ProsSelling = x < y;

addcloud(x, y, (color.GREEN), (color.RED));

plot zerobase = 0;
 
🤔 how didn’t I think of that the whole time. Also for the daily chart keep the standard parameters for the RSI (14)?
Or use MACD---Stochastics......something you can look at and instantly understand what's taking place, an instant confirmation. look at a bigger picture first, weekly......
 
I have watched Jake Bernstein use 57 on the Daily

I'm sorry. I still hang with the ol geezers like myself. He has done stocks and futures for decades.

He is one of the first to use Seasonals to identify trends.

Chris Moody did many of his indicators at one time (i dont think they work together any more) but I cannot complain about his analysis.

He is old, but he is the last of men with integrity-imho.

I have not heard much criticism about him, but I am always open. He has not compromised like the others trying to get rich before they die off. i.e. men like Pesavento moving from harmonics to Jean Dixon style analysis.


He is going to be doing another Wealth Charts 365 coming up. I most definitely dont promote Wealth Charts having tried the Hoffman platform, but Jake shows trades he is going to take in the future. So you can look for that.

He also wrote a book called Cycles of profit that you can look for. Interesting book that covers the repeat of cycles.

If you use TradingView, he has an indicator you can use for free . Type in Jake Bernstein.

His seasonal website is https://seasonaltrader.com/contact.aspx

He has a free one month trial. I am not affiliated with him in any way, shape or form. I have always benefited from his research.
 
Last edited by a moderator:
One thing for sure is this...When I used the 57 on the 6-month daily, it clearly provided when dips should get bought and when rips should get sold, as when an appropriate oscillator is used in conjunction.
 
Any average type of moving average can be tuned for a specific equity... Yes, traders do try using what they think everybody else is using but if you trade just one or two symbols then tuning settings will be beneficial... To fine tune you simply adjust the length to find where you get the most touches or near touches with subsequent reversals... If the market goes through a major change you may need to retune length...

Probably worthy of further discussion in its own topic...
 

Join useThinkScript to post your question to a community of 21,000+ developers and traders.

Similar threads

Not the exact question you're looking for?

Start a new thread and receive assistance from our community.

87k+ Posts
1911 Online
Create Post

Similar threads

Similar threads

The Market Trading Game Changer

Join 2,500+ subscribers inside the useThinkScript VIP Membership Club
  • Exclusive indicators
  • Proven strategies & setups
  • Private Discord community
  • ‘Buy The Dip’ signal alerts
  • Exclusive members-only content
  • Add-ons and resources
  • 1 full year of unlimited support

Frequently Asked Questions

What is useThinkScript?

useThinkScript is the #1 community of stock market investors using indicators and other tools to power their trading strategies. Traders of all skill levels use our forums to learn about scripting and indicators, help each other, and discover new ways to gain an edge in the markets.

How do I get started?

We get it. Our forum can be intimidating, if not overwhelming. With thousands of topics, tens of thousands of posts, our community has created an incredibly deep knowledge base for stock traders. No one can ever exhaust every resource provided on our site.

If you are new, or just looking for guidance, here are some helpful links to get you started.

What are the benefits of VIP Membership?
VIP members get exclusive access to these proven and tested premium indicators: Buy the Dip, Advanced Market Moves 2.0, Take Profit, and Volatility Trading Range. In addition, VIP members get access to over 50 VIP-only custom indicators, add-ons, and strategies, private VIP-only forums, private Discord channel to discuss trades and strategies in real-time, customer support, trade alerts, and much more. Learn all about VIP membership here.
How can I access the premium indicators?
To access the premium indicators, which are plug and play ready, sign up for VIP membership here.
Back
Top
