
I was watching a video on YouTube a while back about trend trading. The guy mentioned something along the line of:
Use something that is no-lag / less-lag like:


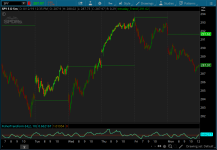
Dark red and green candlesticks mean the stock is trading below yesterday's close. You can combine this indicator with another momentum indicator like the FisherTransform to find your trade entry.
- If the stock is trading below the previous day close then there are more sellers than buyers. The trend is bearish. Look for a short opportunity.
- If the stock is trading above the previous day close then there are more buyers than sellers. There is a strong uptrend. Look for a long opportunity.
Use something that is no-lag / less-lag like:
» Breakout of the opening range high/low (ORH/ORL)
» VWAP confirmation (e.g., long only if above VWAP)
» Volume spike + strong candle close
» Pullback to structure (e.g., VWAP pullback, EMA pullback)
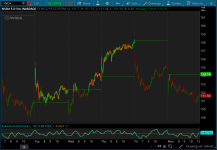
Only trade when this study and confirmation agree.Dark red and green candlesticks mean the stock is trading below yesterday's close. You can combine this indicator with another momentum indicator like the FisherTransform to find your trade entry.
thinkScript Code
Code:
# Intraday Trend Viewer
# Assembled by BenTen at useThinkScript.com

def Today = if GetDay() == GetLastDay() then 1 else 0;

plot ystdClose = close(period = "day" )[1];

ystdClose.SetPaintingStrategy(PaintingStrategy.HORIZONTAL);
ystdClose.SetDefaultColor(Color.UPTICK);
ystdClose.SetLineWeight(1);

AssignPriceColor(if close < ystdClose and open < close then Color.DARK_GREEN
  else if close < ystdClose and open > close then Color.DARK_RED else Color.CURRENT);
Shareable Link
https://tos.mx/ir94MSAttachments
Last edited by a moderator: