
Thanks SleepyZ for all your help, this is exactly what I wanted.
You are using an out of date browser. It may not display this or other websites correctly.
You should upgrade or use an alternative browser.
You should upgrade or use an alternative browser.
Initial Balance Indicator for ThinkorSwim
- Thread starter Tiredoflosing
- Start date
TapthatAsk
Member
@SleepyZ how do I make this indicator in post#15 plot at open like the indicator in post #17? Could they not just be combined into one keeping the concept for post#17 and adding to #15 to make it start on time? this one is exactly what I'm looking for but of course cant really fix all the errors it's giving when trying to combine lol. Why do you think #15 doesn't plot at open? Is it a way to fix it so that it starts at the open like post #17? Here is post #15 indicator https://usethinkscript.com/threads/initial-balance-indicator-for-thinkorswim.6617/post-113108
Thanks in advance
Thanks in advance
Hi SleepyZ, can you please show how to color hilo line. I tried as below but it did not assign color:
hilo.assignvaluecolor(if hilo>hilo[1] then color.magenta else color.cyan);
This script is exactly what I was looking for but couldn't get it to draw the lines/Cloud in real time. There is a significant delay when the lines/could start to be drawn. I would really appreciate if you could update the script to fix this issueThe same fix for the above post seems to work for your revision getting higher opens and lower closes than the opening bars open/close
SugarTrader
Member
Hello, thanks to all contributors to this script. I like the one on post #15 in Ruby's quote.
But I would like the all 4 lines (ORH, ORL...etc) to stop drawing after a certain point in time. ex: 4:00pm NYC.
Could someone help and give a example of how to add this time condition in the code? thanks a lot
But I would like the all 4 lines (ORH, ORL...etc) to stop drawing after a certain point in time. ex: 4:00pm NYC.
Could someone help and give a example of how to add this time condition in the code? thanks a lot
any fix for the delayed painting issue? where there is no range drawn until after 10:35?@SleepyZ You actually revised another high low for me today but I really like the way this one is setup. I even added the 50 line divider plot from the code up above to really see the picture, for some strange reason it doesn't plot during market hours not sure what would be the reasoning.
def na=double.nan;
input CloudOn = yes;
# Define time that OR begins (in hhmm format,
# 0930 is the default):
input ORBegin = 0930;
# Define time that OR is finished (in hhmm format,
# 10:00 is the default):
input OREnd = 1030;
# Show Today only? (Default Yes)
input ShowTodayOnly={"Yes", default "No"};
def s=ShowTodayOnly;
# Create logic for OR definition:
Def ORActive = if secondstilltime(OREnd)>0 AND secondsfromtime(ORBegin)>=0 then 1 else 0;
# Create logic to paint only current day post-open:
def today=if s==0 OR getday()==getlastday() AND secondsfromtime(ORBegin)>=0 then 1 else 0;
# Track OR High:
Rec ORHigh = if ORHigh[1]==0 or ORActive[1]==0 AND ORActive==1 then high else if ORActive AND high>ORHigh[1] then high else ORHigh[1];
# Track OR Low:
Rec ORLow = if ORLow[1]==0 or ORActive[1]==0 AND ORActive==1 then low else if ORActive AND low<ORLow[1] then low else ORLow[1];
# Define all the plots:
Plot ORH=if ORActive OR today<1 then na else ORHigh;
Plot ORL=if ORActive OR today<1 then na else ORLow;
# Formatting:
ORH.setdefaultcolor(color.green);
ORH.setStyle(curve.Firm);
ORH.setlineweight(1);
ORL.setdefaultcolor(color.red);
ORL.setStyle(curve.Firm);
ORL.setlineweight(1);
addCloud(if CloudOn == yes and secondsfromTime(orbegin)>=0 and secondsfromTime(orend)<=0
then orl[-(orend-orbegin)/(getaggregationPeriod()/60000)]
else double.nan
, ORH[-(orend-orbegin)/(getaggregationPeriod()/60000)],createColor(41,98,255), createColor(41,98,255));
# Track OR Open:
Rec OROpen = if OROpen[1]==0 or ORActive[1]==0 AND ORActive==1 then open else if ORActive AND open>OROpen[1] then open else OROpen[1];
# Track OR Close:
Rec ORClose = if ORClose[1]==0 or ORActive[1]==0 AND ORActive==1 then close else if ORActive AND close<ORClose[1] then close else ORClose[1];
# Define all the plots:
Plot ORO=if ORActive OR today<1 then na else OROpen;
Plot ORC=if ORActive OR today<1 then na else ORClose;
Plot ORM=if ORActive OR today<1 then na else (ORHigh + ORLow) / 2;
# Formatting:
ORO.setdefaultcolor(color.green);
ORO.setStyle(curve.Short_DASH);
ORO.setlineweight(1);
ORC.setdefaultcolor(color.red);
ORC.setStyle(curve.Short_DASH);
ORC.setlineweight(1);
addCloud(if CloudOn == yes and secondsfromTime(orbegin)>=0 and secondsfromTime(orend)<=0
then orc[-(orend-orbegin)/(getaggregationPeriod()/60000)]
else double.nan
, ORO[-(orend-orbegin)/(getaggregationPeriod()/60000)],createColor(41,98,255), createColor(41,98,255));
SuperStrater
New member
I’m also looking for this fix. Will be following to see if there are any updates.I have tried but have not been able to rework the code to have the boxes plot right at 9:30, they still start plotting with a delay, still trying tho
@TapthatAsk @JahnJohn @Nevres @prolab @SuperStrater
When using Range All functions, (highestall, inertiaall, e@tc...) The entire plot 'used to' recalculate on every tick.
ToS has reported that they purposefully change these functions to have a built-in lag.
Real time updating of these functions created a strain on TDA resources.
ToS has stated that this change is permanent.
Read more:
https://usethinkscript.com/threads/...-range-lagging-issues-due-to-tos-update.8794/
Forward Thinking
New member
Thank you, Sleepy for the simple looking script. Just what my eyes needed. =PThe same fix for the above post seems to work for your revision getting higher opens and lower closes than the opening bars open/c
I was wondering if someone would be able to add a sound alert on the break outs above and below?
lexcorp666
New member
Is anyone able to modify the code to make it so that the high or low line of the IB stops extending once price has touched it? So that you are only left with the 'virgin'/untouched hi/lo )(that keeps extending until it's touched. Even if it's 3+ days later)
Hope that makes sense
There was an NT indicator somewhere that done that and I quite liked it.
Hope that makes sense
There was an NT indicator somewhere that done that and I quite liked it.
This script is exactly what I was looking for but couldn't get it to draw the lines/Cloud in real time. There is a significant delay when the lines/could start to be drawn. I would really appreciate if you could update the script to fix this issue
Sorry, just saw this
This should start plotting the developing opening range at the times input. It will use two clouds to distinguish the opening range from the extended one.

Code:#OpeningRange_Developing_in_Separate_Cloud_Color script r { input oTime = 2300; input cTime = 0500; input extend = yes; input showlastonly = yes; def sec1 = SecondsFromTime(oTime); def sec2 = SecondsFromTime(cTime); def isTime1 = (sec1 >= 0 and sec1[1] < 0) or (sec1 < sec1[1] and sec1 >= 0); def isTime2 = (sec2 >= 0 and sec2[1] < 0) or (sec2 < sec2[1] and sec2 >= 0); def inRange = CompoundValue(1, if isTime1 then 1 else if isTime2 then 0 else inRange[1], 0); def bars = 200000; input pricePerRowHeightMode = { AUTOMATIC, default TICKSIZE, CUSTOM}; input customRowHeight = 1.0; input timePerProfile = {default BAR}; input onExpansion = no; input profiles = 1000; def period; switch (timePerProfile) { case BAR: period = BarNumber() - 1; } def count = CompoundValue(1, if inRange and period != period[1] then (count[1] + period - period[1]) % bars else count[1], 0); def cond = count < count[1] + period - period[1]; def height; switch (pricePerRowHeightMode) { case AUTOMATIC: height = PricePerRow.AUTOMATIC; case TICKSIZE: height = PricePerRow.TICKSIZE; case CUSTOM: height = customRowHeight; } profile vol = VolumeProfile("startNewProfile" = cond, "onExpansion" = no, "numberOfProfiles" = 1000, "pricePerRow" = height, "value area percent" = 0); def con = CompoundValue(1, onExpansion, no); def hProfile = if inRange and IsNaN(vol.GetHighest()) and con then hProfile[1] else vol.GetHighest(); def lProfile = if inRange and IsNaN(vol.GetLowest()) and con then lProfile[1] else vol.GetLowest(); def plotsDomain = IsNaN(close) == onExpansion; def ProfileHigh = if inRange and plotsDomain then hProfile else if extend then ProfileHigh[1] else Double.NaN; def ProfileLow = if inRange and plotsDomain then lProfile else if extend then ProfileLow[1] else Double.NaN; def dataCount = CompoundValue(1, if cond != cond[1] then dataCount[1] + 1 else dataCount[1] , 0); plot hrange = if !showlastonly then ProfileHigh else if showlastonly and HighestAll(dataCount) - dataCount <= if cTime <= 0000 then 2 else 1 then ProfileHigh else Double.NaN; plot lrange = if !showlastonly then ProfileLow else if showlastonly and HighestAll(dataCount) - dataCount <= if cTime <= 0000 then 2 else 1 then ProfileLow else Double.NaN; } input showclouds = yes; input showbubbles = yes; input showbubble_times = yes; input showlastonly = yes; input otime1 = 0930; input ctime1 = 1030; #Horizontal Lines - Separate input for line_extend was necessary as request was for extended lines, whereas the clouds were not wanted to extend by the times input input line_extend = yes; plot r1h = r(otime1, ctime1, extend = line_extend, showlastonly = showlastonly); plot r1l = r(otime1, ctime1, extend = line_extend, showlastonly = showlastonly).lrange; plot mid = (r1h + r1l) / 2; DefineGlobalColor("H", Color.LIGHT_GREEN); DefineGlobalColor("L", Color.LIGHT_RED); r1h.SetPaintingStrategy(PaintingStrategy.HORIZONTAL); r1l.SetPaintingStrategy(PaintingStrategy.HORIZONTAL); r1h.SetDefaultColor(GlobalColor("H")); r1l.SetDefaultColor(GlobalColor("L")); #Clouds - Cloud plots for cloud1-3 hl are needed input cloud_extend = no; plot cloud1h = r(otime1, ctime1, extend = cloud_extend, showlastonly = showlastonly); plot cloud1l = r(otime1, ctime1, extend = cloud_extend, showlastonly = showlastonly).lrange; DefineGlobalColor("OR", Color.WHITE); DefineGlobalColor("OR EXT", Color.CYAN); input show_cloud_1 = yes; input show_cloud_2 = yes; AddCloud(if showclouds and show_cloud_1 then r(otime1, ctime1, extend = no, showlastonly = showlastonly) else Double.NaN, r(otime1, ctime1, extend = no, showlastonly = showlastonly).lrange, GlobalColor("OR"), GlobalColor("OR")); AddCloud(if showclouds and show_cloud_2 and SecondsFromTime(ctime1) >= 0 then r(otime1, ctime1, extend = yes, showlastonly = showlastonly) else Double.NaN, r(otime1, ctime1, extend = yes, showlastonly = showlastonly).lrange, GlobalColor("OR EXT"), GlobalColor("OR EXT")); input bubblemover = 5; def b = bubblemover; def b1 = b + 1; def mover = showbubbles and IsNaN(close[b]) and !IsNaN(close[b1]); AddChartBubble(mover, r1h[b1], if showbubble_times then AsPrice(otime1) + " : " + AsPrice(ctime1) + "\nH: " + AsText(r1h) else "H: " + AsText(r1h), r1h.TakeValueColor()); AddChartBubble(mover, r1l, if showbubble_times then AsPrice(otime1) + " : " + AsPrice(ctime1) + "\nL: " + AsText(r1l) else "L: " + AsText(r1l), r1l.TakeValueColor(), up = no); AddChartBubble(mover, mid, if showbubble_times then AsPrice(otime1) + " : " + AsPrice(ctime1) + "\nM: " + AsText(mid) else "M: " + AsText(mid), mid.TakeValueColor(), up = no); #
Last edited:
@SleepyZ@SleepyZ You actually revised another high low for me today but I really like the way this one is setup. I even added the 50 line divider plot from the code up above to really see the picture, for some strange reason it doesn't plot during market hours not sure what would be the reasoning.
def na=double.nan;
input CloudOn = yes;
# Define time that OR begins (in hhmm format,
# 0930 is the default):
input ORBegin = 0930;
# Define time that OR is finished (in hhmm format,
# 10:00 is the default):
input OREnd = 1030;
# Show Today only? (Default Yes)
input ShowTodayOnly={"Yes", default "No"};
def s=ShowTodayOnly;
# Create logic for OR definition:
Def ORActive = if secondstilltime(OREnd)>0 AND secondsfromtime(ORBegin)>=0 then 1 else 0;
# Create logic to paint only current day post-open:
def today=if s==0 OR getday()==getlastday() AND secondsfromtime(ORBegin)>=0 then 1 else 0;
# Track OR High:
Rec ORHigh = if ORHigh[1]==0 or ORActive[1]==0 AND ORActive==1 then high else if ORActive AND high>ORHigh[1] then high else ORHigh[1];
# Track OR Low:
Rec ORLow = if ORLow[1]==0 or ORActive[1]==0 AND ORActive==1 then low else if ORActive AND low<ORLow[1] then low else ORLow[1];
# Define all the plots:
Plot ORH=if ORActive OR today<1 then na else ORHigh;
Plot ORL=if ORActive OR today<1 then na else ORLow;
# Formatting:
ORH.setdefaultcolor(color.green);
ORH.setStyle(curve.Firm);
ORH.setlineweight(1);
ORL.setdefaultcolor(color.red);
ORL.setStyle(curve.Firm);
ORL.setlineweight(1);
addCloud(if CloudOn == yes and secondsfromTime(orbegin)>=0 and secondsfromTime(orend)<=0
then orl[-(orend-orbegin)/(getaggregationPeriod()/60000)]
else double.nan
, ORH[-(orend-orbegin)/(getaggregationPeriod()/60000)],createColor(41,98,255), createColor(41,98,255));
# Track OR Open:
Rec OROpen = if OROpen[1]==0 or ORActive[1]==0 AND ORActive==1 then open else if ORActive AND open>OROpen[1] then open else OROpen[1];
# Track OR Close:
Rec ORClose = if ORClose[1]==0 or ORActive[1]==0 AND ORActive==1 then close else if ORActive AND close<ORClose[1] then close else ORClose[1];
# Define all the plots:
Plot ORO=if ORActive OR today<1 then na else OROpen;
Plot ORC=if ORActive OR today<1 then na else ORClose;
Plot ORM=if ORActive OR today<1 then na else (ORHigh + ORLow) / 2;
# Formatting:
ORO.setdefaultcolor(color.green);
ORO.setStyle(curve.Short_DASH);
ORO.setlineweight(1);
ORC.setdefaultcolor(color.red);
ORC.setStyle(curve.Short_DASH);
ORC.setlineweight(1);
addCloud(if CloudOn == yes and secondsfromTime(orbegin)>=0 and secondsfromTime(orend)<=0
then orc[-(orend-orbegin)/(getaggregationPeriod()/60000)]
else double.nan
, ORO[-(orend-orbegin)/(getaggregationPeriod()/60000)],createColor(41,98,255), createColor(41,98,255));
#plot opening price at 0930H and stop plotting at 1600 or market close
def OpenPrice=secondsFromTime(OrBegin)==0;
def isRDROpen = SecondsFromTime(ORBegin) == 0;
def OpeningPrice = if isRDROpen then open else OpeningPrice[1];
plot theOpen = OpeningPrice;
theOpen.setDefaultColor(Color.GRAY);
Managed to modify and plot the opening line but it does not stop at 1600H
Can you or anyone help to correct this..
thanks
@SleepyZ
#plot opening price at 0930H and stop plotting at 1600 or market close
def OpenPrice=secondsFromTime(OrBegin)==0;
def isRDROpen = SecondsFromTime(ORBegin) == 0;
def OpeningPrice = if isRDROpen then open else OpeningPrice[1];
plot theOpen = OpeningPrice;
theOpen.setDefaultColor(Color.GRAY);
Managed to modify and plot the opening line but it does not stop at 1600H
Can you or anyone help to correct this..
thanks
This will plot the open price during the input times begin/end
Code:#plot opening price at 0930H and stop plotting at 1600 or market close input orbegin = 0930; input orend = 1600; def OpenPrice = SecondsFromTime(orbegin) == 0; def isRDROpen = SecondsFromTime(orbegin) >= 0 and SecondsFromTime(orend) <= 0; def OpeningPrice = if Openprice then open else OpeningPrice[1]; plot theOpen = if isRDRopen then OpeningPrice else Double.NaN; theOpen.SetDefaultColor(Color.GRAY);
TapthatAsk
Member
So where do I add this to make this plot during open? Here's the original code which is beautiful but just takes awhile to start showing on the chart.This will plot the open price during the input times begin/end
input start = 0930;
input end = 1030;
def na=double.nan;
input CloudOn = yes;
# Define time that OR begins (in hhmm format,
# 0930 is the default):
input ORBegin = 0930;
# Define time that OR is finished (in hhmm format,
# 10:00 is the default):
input OREnd = 1030;
# Show Today only? (Default Yes)
input ShowTodayOnly={"Yes", default "No"};
def s=ShowTodayOnly;
# Create logic for OR definition:
Def ORActive = if secondstilltime(OREnd)>0 AND secondsfromtime(ORBegin)>=0 then 1 else 0;
# Create logic to paint only current day post-open:
def today=if s==0 OR getday()==getlastday() AND secondsfromtime(ORBegin)>=0 then 1 else 0;
# Track OR High:
Rec ORHigh = if ORHigh[1]==0 or ORActive[1]==0 AND ORActive==1 then high else if ORActive AND high>ORHigh[1] then high else ORHigh[1];
# Track OR Low:
Rec ORLow = if ORLow[1]==0 or ORActive[1]==0 AND ORActive==1 then low else if ORActive AND low<ORLow[1] then low else ORLow[1];
# Define all the plots:
Plot ORH=if ORActive OR today<1 then na else ORHigh;
Plot ORL=if ORActive OR today<1 then na else ORLow;
# Formatting:
ORH.setdefaultcolor(color.green);
ORH.setStyle(curve.Firm);
ORH.setlineweight(1);
ORL.setdefaultcolor(color.red);
ORL.setStyle(curve.Firm);
ORL.setlineweight(1);
addCloud(if CloudOn == yes and secondsfromTime(orbegin)>=0 and secondsfromTime(orend)<=0
then orl[-(orend-orbegin)/(getaggregationPeriod()/60000)]
else double.nan
, ORH[-(orend-orbegin)/(getaggregationPeriod()/60000)],color.gray, color.gray);
# Track OR Open:
Rec OROpen = if OROpen[1]==0 or ORActive[1]==0 AND ORActive==1 then open else if ORActive AND open>OROpen[1] then open else OROpen[1];
# Track OR Close:
Rec ORClose = if ORClose[1]==0 or ORActive[1]==0 AND ORActive==1 then close else if ORActive AND close<ORClose[1] then close else ORClose[1];
# Define all the plots:
Plot ORO=if ORActive OR today<1 then na else OROpen;
Plot ORC=if ORActive OR today<1 then na else ORClose;
Plot ORM=if ORActive OR today<1 then na else (ORHigh + ORLow) / 2;
# Formatting:
ORO.setdefaultcolor(color.green);
ORO.setStyle(curve.Short_DASH);
ORO.setlineweight(1);
ORC.setdefaultcolor(color.red);
ORC.setStyle(curve.Short_DASH);
ORC.setlineweight(1);
addCloud(if CloudOn == yes and secondsfromTime(orbegin)>=0 and secondsfromTime(orend)<=0
then orc[-(orend-orbegin)/(getaggregationPeriod()/60000)]
else double.nan
, ORO[-(orend-orbegin)/(getaggregationPeriod()/60000)],color.black, color.black);
The same fix for the above post seems to work for your revision getting higher opens and lower closes than the opening bars open/close
@SleepyZ, I have three requests that need your assistance
May I request your assistance to correct this script, I attempted to plot the DR for 0300 to 0400, which marks the High and low points of the DR, but I noticed that the DR line only starts to plot at 0400 instead of 0300.
Secondly, I would like to plot the highest Body close and lowest Body close within the DR
lastly, may I also request to colour the box when the condition is met
When Closing Price @0400 is greater than Opening Price@0300, Green Box
When Closing Price @ 0400 is lower than the Opening Price @0300 , Red Box
######################################
input orbegin1 = 0300;
input orclose3 = 0425;
input orend2 = 0930;
def OpenPrice = SecondsFromTime(orbegin1) == 0;
def isRDROpen = SecondsFromTime(orbegin1) >= 0 and SecondsFromTime(orend2) <= 0;
def OpeningPrice = if Openprice then open else OpeningPrice[1];
plot theOpen = if isRDRopen then OpeningPrice else Double.NaN;
theOpen.SetDefaultColor(Color.white);
def ClosePrice = SecondsFromTime(orclose3) == 0;
def isRDRclose = SecondsFromTime(orclose3) >= 0 and SecondsFromTime(orend2) <= 0;
def ClosingPrice = if Closeprice then close else ClosingPrice[1];
plot theClose = if isRDRclose then ClosingPrice else Double.NaN;
theClose.SetDefaultColor(Color.MagentA);
def na=double.nan;
input CloudOn = yes;
# Define time that OR begins (in hhmm format,
# 0930 is the default):
input ORBegin = 0300;
# Define time that OR is finished (in hhmm format,
# 10:00 is the default):
input OREnd =0400;
# Show Today only? (Default Yes)
input ShowTodayOnly={"Yes", default "No"};
def s=ShowTodayOnly;
# Create logic for OR definition:
Def ORActive = if secondstilltime(OREnd)>0 AND secondsfromtime(ORBegin)>=0 then 1 else 0;
# Create logic to paint only current day post-open:
def today=if s==0 OR getday()==getlastday() AND secondsfromtime(ORBegin)>=0 then 1 else 0;
# Track OR High:
Rec ORHigh = if ORHigh[1]==0 or ORActive[1]==0 AND ORActive==1 then high else if ORActive AND high>ORHigh[1] then high else ORHigh[1];
# Track OR Low:
Rec ORLow = if ORLow[1]==0 or ORActive[1]==0 AND ORActive==1 then low else if ORActive AND low<ORLow[1] then low else ORLow[1];
# Define all the plots:
Plot ORH=if ORActive OR today<1 then na else ORHigh;
Plot ORL=if ORActive OR today<1 then na else ORLow;
# Formatting:
ORH.setdefaultcolor(color.green);
ORH.setStyle(curve.Firm);
ORH.setlineweight(1);
ORL.setdefaultcolor(color.red);
ORL.setStyle(curve.Firm);
ORL.setlineweight(1);
addCloud(if CloudOn == yes and secondsfromTime(orbegin)>=0 and secondsfromTime(OREnd)<=0
then orl[-(oREnd-orbegin)/(getaggregationPeriod()/60000)]
else double.nan
, ORH[-(OREnd-orbegin)/(getaggregationPeriod()/60000)],createColor(41,98,255), createColor(41,98,255));
# Track OR Open:
Rec OROpen = if OROpen[1]==0 or ORActive[1]==0 AND ORActive==1 then open else if ORActive AND open>OROpen[1] then open else OROpen[1];
# Track OR Close:
Rec ORClose = if ORClose[1]==0 or ORActive[1]==0 AND ORActive==1 then close else if ORActive AND close<ORClose[1] then close else ORClose[1];
Thank you so much for all your help
Attachments
View attachment 19632
View attachment 19634
@SleepyZ, I have three requests that need your assistance
May I request your assistance to correct this script, I attempted to plot the DR for 0300 to 0400, which marks the High and low points of the DR, but I noticed that the DR line only starts to plot at 0400 instead of 0300.
Secondly, I would like to plot the highest Body close and lowest Body close within the DR
lastly, may I also request to colour the box when the condition is met
When Closing Price @0400 is greater than Opening Price@0300, Green Box
When Closing Price @ 0400 is lower than the Opening Price @0300 , Red Box
######################################
input orbegin1 = 0300;
input orclose3 = 0425;
input orend2 = 0930;
def OpenPrice = SecondsFromTime(orbegin1) == 0;
def isRDROpen = SecondsFromTime(orbegin1) >= 0 and SecondsFromTime(orend2) <= 0;
def OpeningPrice = if Openprice then open else OpeningPrice[1];
plot theOpen = if isRDRopen then OpeningPrice else Double.NaN;
theOpen.SetDefaultColor(Color.white);
def ClosePrice = SecondsFromTime(orclose3) == 0;
def isRDRclose = SecondsFromTime(orclose3) >= 0 and SecondsFromTime(orend2) <= 0;
def ClosingPrice = if Closeprice then close else ClosingPrice[1];
plot theClose = if isRDRclose then ClosingPrice else Double.NaN;
theClose.SetDefaultColor(Color.MagentA);
def na=double.nan;
input CloudOn = yes;
# Define time that OR begins (in hhmm format,
# 0930 is the default):
input ORBegin = 0300;
# Define time that OR is finished (in hhmm format,
# 10:00 is the default):
input OREnd =0400;
# Show Today only? (Default Yes)
input ShowTodayOnly={"Yes", default "No"};
def s=ShowTodayOnly;
# Create logic for OR definition:
Def ORActive = if secondstilltime(OREnd)>0 AND secondsfromtime(ORBegin)>=0 then 1 else 0;
# Create logic to paint only current day post-open:
def today=if s==0 OR getday()==getlastday() AND secondsfromtime(ORBegin)>=0 then 1 else 0;
# Track OR High:
Rec ORHigh = if ORHigh[1]==0 or ORActive[1]==0 AND ORActive==1 then high else if ORActive AND high>ORHigh[1] then high else ORHigh[1];
# Track OR Low:
Rec ORLow = if ORLow[1]==0 or ORActive[1]==0 AND ORActive==1 then low else if ORActive AND low<ORLow[1] then low else ORLow[1];
# Define all the plots:
Plot ORH=if ORActive OR today<1 then na else ORHigh;
Plot ORL=if ORActive OR today<1 then na else ORLow;
# Formatting:
ORH.setdefaultcolor(color.green);
ORH.setStyle(curve.Firm);
ORH.setlineweight(1);
ORL.setdefaultcolor(color.red);
ORL.setStyle(curve.Firm);
ORL.setlineweight(1);
addCloud(if CloudOn == yes and secondsfromTime(orbegin)>=0 and secondsfromTime(OREnd)<=0
then orl[-(oREnd-orbegin)/(getaggregationPeriod()/60000)]
else double.nan
, ORH[-(OREnd-orbegin)/(getaggregationPeriod()/60000)],createColor(41,98,255), createColor(41,98,255));
# Track OR Open:
Rec OROpen = if OROpen[1]==0 or ORActive[1]==0 AND ORActive==1 then open else if ORActive AND open>OROpen[1] then open else OROpen[1];
# Track OR Close:
Rec ORClose = if ORClose[1]==0 or ORActive[1]==0 AND ORActive==1 then close else if ORActive AND close<ORClose[1] then close else ORClose[1];
Thank you so much for all your help
This uses the Volumeprofile ProfileHigh/Low to plot those during the opening range.
 Code:
Code:#OpeningRangeHL_BodyHL ###################################### # Show Today only? (Default Yes) input ShowTodayOnly = {"Yes", default "No"}; input orbegin1 = 0300; input orclose3 = 0425; input orend2 = 0930; input CloudOn = yes; # Create logic to paint only current day post-open: def s = !ShowTodayOnly; def today = if s == 0 or GetDay() == GetLastDay() and SecondsFromTime(orbegin1) >= 0 then 1 else 0; def na = Double.NaN; def OpenPrice = SecondsFromTime(orbegin1) == 0; def isRDROpen = SecondsFromTime(orbegin1) >= 0 and SecondsFromTime(orend2) <= 0; def OpeningPrice = if OpenPrice then open else OpeningPrice[1]; plot theOpen = if today < 1 then na else OpeningPrice; theOpen.SetDefaultColor(Color.WHITE); theOpen.SetPaintingStrategy(PaintingStrategy.DASHES); def ClosePrice = SecondsFromTime(orclose3)[1] <= 0 and SecondsFromTime(orclose3) >= 0; def isRDRclose = SecondsFromTime(orclose3) >= 0 and SecondsFromTime(orend2) <= 0; def ClosingPrice = if ClosePrice then close else ClosingPrice[1]; plot theClose = if today < 1 then na else ClosingPrice; theClose.SetDefaultColor(Color.MAGENTA); theClose.SetPaintingStrategy(PaintingStrategy.DASHES); # Define time that OR begins (in hhmm format, # 0930 is the default): input ORBegin = 0300; # Define time that OR is finished (in hhmm format, # 10:00 is the default): input OREnd = 0400; # Create logic for OR definition: def ORActive = if SecondsTillTime(OREnd) >= 0 and SecondsFromTime(ORBegin) >= 0 then 1 else 0; #High/Low starting at orbegin1 using VolumeProfile ProffileHigh/ProfileLow using bars setting for period def bars = 50000; input extend = yes; input pricePerRowHeightMode = { AUTOMATIC, default TICKSIZE, CUSTOM}; input customRowHeight = 1.0; input timePerProfile = {default BAR}; input onExpansion = no; input profiles = 1; def period; switch (timePerProfile) { case BAR: period = BarNumber() - 1; } def count = CompoundValue(1, if ORActive and period != period[1] then (count[1] + period - period[1]) % bars else count[1], 0); def cond = count < count[1] + period - period[1]; def height; switch (pricePerRowHeightMode) { case AUTOMATIC: height = PricePerRow.AUTOMATIC; case TICKSIZE: height = PricePerRow.TICKSIZE; case CUSTOM: height = customRowHeight; } profile vol = VolumeProfile("startNewProfile" = cond, "onExpansion" = no, "numberOfProfiles" = 1000, "pricePerRow" = height, "value area percent" = 0); def con = CompoundValue(1, onExpansion, no); def hProfile = if ORActive and IsNaN(vol.GetHighest()) and con then hProfile[1] else vol.GetHighest(); def lProfile = if ORActive and IsNaN(vol.GetLowest()) and con then lProfile[1] else vol.GetLowest(); def plotsDomain = IsNaN(close) == onExpansion; def ProfileHigh = if ORActive and plotsDomain then hProfile else if extend then ProfileHigh[1] else Double.NaN; def ProfileLow = if ORActive and plotsDomain then lProfile else if extend then ProfileLow[1] else Double.NaN; # Track OR High: rec ORHigh = ProfileHigh;#if ORHigh[1] == 0 or ORActive[1] == 0 and ORActive == 1 then high else if ORActive and high > ORHigh[1] then high else ORHigh[1]; # Track OR Low: rec ORLow = ProfileLow;#if ORLow[1] == 0 or ORActive[1] == 0 and ORActive == 1 then low else if ORActive and low < ORLow[1] then low else ORLow[1]; # Define all the plots: plot ORH = if #ORActive or today < 1 then na else ORHigh; plot ORL = if #ORActive or today < 1 then na else ORLow; # Formatting: ORH.SetDefaultColor(Color.GREEN); ORH.SetPaintingStrategy(PaintingStrategy.HORIZONTAL); ORH.SetLineWeight(1); ORL.SetDefaultColor(Color.RED); ORL.SetPaintingStrategy(PaintingStrategy.HORIZONTAL); ORL.SetLineWeight(1); # Track OR Open: rec OROpen = if OROpen[1] == 0 or ORActive[1] == 0 and ORActive == 1 then open else if ORActive and open > OROpen[1] then open else OROpen[1]; # Track OR Close: rec ORClose = if ORClose[1] == 0 or ORActive[1] == 0 and ORActive == 1 then close else if ORActive and close #> ORClose[1] then close else ORClose[1]; def green = if SecondsFromTime(OREnd) <= 0 then if ORClose > OpeningPrice then 1 else 0 else green[1]; def g = green; input label = yes; AddLabel(label, "ORClose: " + ORClose + (if green == 1 then " > " else " < ") + " OROpen: " + OpeningPrice + " ", if green == 1 then Color.GREEN else Color.LIGHT_RED); AddCloud(if CloudOn == yes and SecondsFromTime(ORBegin) >= 0 and SecondsFromTime(OREnd) <= 0 and g[-(OREnd - ORBegin) / (GetAggregationPeriod() / 60000)] == 1 then ORL[-(OREnd - ORBegin) / (GetAggregationPeriod() / 60000)] else Double.NaN, ORH[-(OREnd - ORBegin) / (GetAggregationPeriod() / 60000)], Color.GREEN, Color.GREEN); AddCloud(if CloudOn == yes and SecondsFromTime(ORBegin) >= 0 and SecondsFromTime(OREnd) <= 0 and g[-(OREnd - ORBegin) / (GetAggregationPeriod() / 60000)] == 0 then ORL[-(OREnd - ORBegin) / (GetAggregationPeriod() / 60000)] else Double.NaN, ORH[-(OREnd - ORBegin) / (GetAggregationPeriod() / 60000)], Color.RED, Color.RED); # Track OR BodyHeight High: def bodyhigh = Max(close, open); rec ORBodyHigh = if ORHigh[1] == 0 or ORActive[1] == 0 and ORActive == 1 then bodyhigh else if ORActive and bodyhigh > ORBodyHigh[1] then bodyhigh else ORBodyHigh[1]; # Track OR BodyHeight Low: def bodylow = Min(close, open); rec ORBodyLow = if ORBodyLow[1] == 0 or ORActive[1] == 0 and ORActive == 1 then bodylow else if ORActive and bodylow < ORBodyLow[1] then bodylow else ORBodyLow[1]; # Define all the plots: plot ORBodyH = if ORActive or today < 1 then na else ORBodyHigh; plot ORBodyL = if ORActive or today < 1 then na else ORBodyLow; # Formatting: ORBodyH.SetDefaultColor(Color.GREEN); ORBodyH.SetPaintingStrategy(PaintingStrategy.DASHES); ORBodyH.SetLineWeight(1); ORBodyL.SetDefaultColor(Color.RED); ORBodyL.SetPaintingStrategy(PaintingStrategy.DASHES); ORBodyL.SetLineWeight(1); #
So where do I add this to make this plot during open? Here's the original code which is beautiful but just takes awhile to start showing on the chart.
input start = 0930;
input end = 1030;
def na=double.nan;
input CloudOn = yes;
# Define time that OR begins (in hhmm format,
# 0930 is the default):
input ORBegin = 0930;
# Define time that OR is finished (in hhmm format,
# 10:00 is the default):
input OREnd = 1030;
# Show Today only? (Default Yes)
input ShowTodayOnly={"Yes", default "No"};
def s=ShowTodayOnly;
# Create logic for OR definition:
Def ORActive = if secondstilltime(OREnd)>0 AND secondsfromtime(ORBegin)>=0 then 1 else 0;
# Create logic to paint only current day post-open:
def today=if s==0 OR getday()==getlastday() AND secondsfromtime(ORBegin)>=0 then 1 else 0;
# Track OR High:
Rec ORHigh = if ORHigh[1]==0 or ORActive[1]==0 AND ORActive==1 then high else if ORActive AND high>ORHigh[1] then high else ORHigh[1];
# Track OR Low:
Rec ORLow = if ORLow[1]==0 or ORActive[1]==0 AND ORActive==1 then low else if ORActive AND low<ORLow[1] then low else ORLow[1];
# Define all the plots:
Plot ORH=if ORActive OR today<1 then na else ORHigh;
Plot ORL=if ORActive OR today<1 then na else ORLow;
# Formatting:
ORH.setdefaultcolor(color.green);
ORH.setStyle(curve.Firm);
ORH.setlineweight(1);
ORL.setdefaultcolor(color.red);
ORL.setStyle(curve.Firm);
ORL.setlineweight(1);
addCloud(if CloudOn == yes and secondsfromTime(orbegin)>=0 and secondsfromTime(orend)<=0
then orl[-(orend-orbegin)/(getaggregationPeriod()/60000)]
else double.nan
, ORH[-(orend-orbegin)/(getaggregationPeriod()/60000)],color.gray, color.gray);
# Track OR Open:
Rec OROpen = if OROpen[1]==0 or ORActive[1]==0 AND ORActive==1 then open else if ORActive AND open>OROpen[1] then open else OROpen[1];
# Track OR Close:
Rec ORClose = if ORClose[1]==0 or ORActive[1]==0 AND ORActive==1 then close else if ORActive AND close<ORClose[1] then close else ORClose[1];
# Define all the plots:
Plot ORO=if ORActive OR today<1 then na else OROpen;
Plot ORC=if ORActive OR today<1 then na else ORClose;
Plot ORM=if ORActive OR today<1 then na else (ORHigh + ORLow) / 2;
# Formatting:
ORO.setdefaultcolor(color.green);
ORO.setStyle(curve.Short_DASH);
ORO.setlineweight(1);
ORC.setdefaultcolor(color.red);
ORC.setStyle(curve.Short_DASH);
ORC.setlineweight(1);
addCloud(if CloudOn == yes and secondsfromTime(orbegin)>=0 and secondsfromTime(orend)<=0
then orc[-(orend-orbegin)/(getaggregationPeriod()/60000)]
else double.nan
, ORO[-(orend-orbegin)/(getaggregationPeriod()/60000)],color.black, color.black);
Try this. Same type of mods as in https://usethinkscript.com/threads/initial-balance-indicator-for-thinkorswim.6617/post-131448
Code:input ORBegin = 0930; input OREnd = 1030; def na = Double.NaN; input CloudOn = yes; # Show Today only? (Default Yes) input ShowTodayOnly = {"Yes", default "No"}; def s = ShowTodayOnly; # Create logic for OR definition: Def ORActive = if secondstilltime(OREnd)>0 AND secondsfromtime(ORBegin)>=0 then 1 else 0; # Create logic to paint only current day post-open: def today = if s == 1 or GetDay() == GetLastDay() and SecondsFromTime(ORBegin) >= 0 then 1 else 0; #High/Low starting at orbegin1 using VolumeProfile ProffileHigh/ProfileLow using bars setting for period def bars = 50000; input extend = yes; input pricePerRowHeightMode = { AUTOMATIC, default TICKSIZE, CUSTOM}; input customRowHeight = 1.0; input timePerProfile = {default BAR}; input onExpansion = no; input profiles = 1; def period; switch (timePerProfile) { case BAR: period = BarNumber() - 1; } def count = CompoundValue(1, if ORActive and period != period[1] then (count[1] + period - period[1]) % bars else count[1], 0); def cond = count < count[1] + period - period[1]; def height; switch (pricePerRowHeightMode) { case AUTOMATIC: height = PricePerRow.AUTOMATIC; case TICKSIZE: height = PricePerRow.TICKSIZE; case CUSTOM: height = customRowHeight; } profile vol = VolumeProfile("startNewProfile" = cond, "onExpansion" = no, "numberOfProfiles" = 1000, "pricePerRow" = height, "value area percent" = 0); def con = CompoundValue(1, onExpansion, no); def hProfile = if ORActive and IsNaN(vol.GetHighest()) and con then hProfile[1] else vol.GetHighest(); def lProfile = if ORActive and IsNaN(vol.GetLowest()) and con then lProfile[1] else vol.GetLowest(); def plotsDomain = IsNaN(close) == onExpansion; def ProfileHigh = if ORActive and plotsDomain then hProfile else if extend then ProfileHigh[1] else Double.NaN; def ProfileLow = if ORActive and plotsDomain then lProfile else if extend then ProfileLow[1] else Double.NaN; # Track OR High: rec ORHigh = Profilehigh; # Track OR Low: rec ORLow = ProfileLow; # Define all the plots: plot ORH = if today < 1 then na else ORHigh; plot ORL = if today < 1 then na else ORLow; # Formatting: ORH.SetDefaultColor(Color.GREEN); ORH.SetPaintingStrategy(PaintingStrategy.HORIZONTAL); ORH.SetLineWeight(1); ORL.SetDefaultColor(Color.RED); ORL.SetPaintingStrategy(PaintingStrategy.HORIZONTAL); ORL.SetLineWeight(1); AddCloud(data1 = if CloudOn == yes and SecondsFromTime(ORBegin) >= 0 and SecondsFromTime(OREnd) <= 0 then ORL[-(OREnd - ORBegin) / (GetAggregationPeriod() / 60000)] else Double.NaN, data2 = ORH[-(OREnd - ORBegin) / (GetAggregationPeriod() / 60000)], color1 = Color.GRAY, color2 = Color.GRAY); # Track OR Open: Rec OROpen = if OROpen[1]==0 or ORActive[1]==0 AND ORActive==1 then open else if ORActive AND open>OROpen[1] then open else OROpen[1]; # Track OR Close: Rec ORClose = if ORClose[1]==0 or ORActive[1]==0 AND ORActive==1 then close else if ORActive AND close<ORClose[1] then close else ORClose[1]; # Define all the plots: plot ORO = if ORActive or today < 1 then na else OROpen; plot ORC = if ORActive or today < 1 then na else ORClose; plot ORM = if ORActive or today < 1 then na else (ORHigh + ORLow) / 2; # Formatting: ORO.SetDefaultColor(Color.GREEN); ORO.SetStyle(Curve.SHORT_DASH); ORO.SetLineWeight(1); ORC.SetDefaultColor(Color.RED); ORC.SetStyle(Curve.SHORT_DASH); ORC.SetLineWeight(1); AddCloud(data1 = if CloudOn == yes and SecondsFromTime(ORBegin) >= 0 and SecondsFromTime(OREnd) <= 0 then ORC[-(OREnd - ORBegin) / (GetAggregationPeriod() / 60000)] else Double.NaN, data2 = ORO[-(OREnd - ORBegin) / (GetAggregationPeriod() / 60000)], color1 = Color.BLACK, color2 = Color.BLACK);
kevinhng77
New member
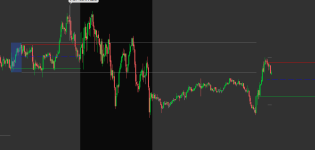
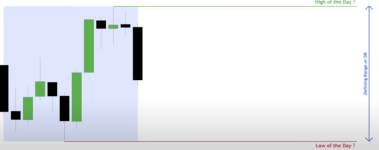
I found this script that plots a moving line that changes as the hod changes, but I've been trying to change the time so that it starts during the previous day after hours instead of the current day pre market and can't figure it out. Can someone help me out with this? I also attached 2 pictures below. First one is what it's currently showing. Second one is ideally what I want. The hod line starts as the market closes and continues from there.
Code:
input ShowTodayOnly = yes;
input start = {default premarket};
input onexpansion = no;
def YYYYMMDD = GetYYYYMMDD();
def yesterdaytest = if YYYYMMDD != YYYYMMDD[1] then YYYYMMDD[1] else yesterdaytest[1];
#plot tester = if getday() >= yesterdaytest and SecondsTillTime(1600)!=0 then 1 else 0;
def ORActive = if start == start.premarket
#then if ORActive[1] == 0 #and
#GetYYYYMMDD() != GetYYYYMMDD()[1]
#then 1
then if #ORActive[1] == 1 or
GetTime() <= RegularTradingend(getyyyymmdd())
#GetTime() <= regulartradingend(yesterdaytest)
#GetTime() <= RegularTradingend(GetYYYYMMDD())
#and GetTime() > RegularTradingEnd(GetYYYYMMDD())
then 1
else 0
else 0;
def ORHigh = if ORHigh[1] == 0 or
ORActive[1] == 0 and
ORActive == 1
then high
else if ORActive and
high > ORHigh[1]
then high
else ORHigh[1];
plot ORH = if (ShowTodayOnly and
GetDay() != GetLastDay()) or
!ORActive
then Double.NaN
else if !onexpansion
then ORHigh
else Double.NaN;
ORH.SetDefaultColor(Color.GREEN);
ORH.SetStyle(Curve.MEDIUM_DASH);
ORH.SetLineWeight(1);
Attachments
I found this script that plots a moving line that changes as the hod changes, but I've been trying to change the time so that it starts during the previous day after hours instead of the current day pre market and can't figure it out. Can someone help me out with this? I also attached 2 pictures below. First one is what it's currently showing. Second one is ideally what I want. The hod line starts as the market closes and continues from there.
Code:
input ShowTodayOnly = yes;
input start = {default premarket};
input onexpansion = no;
def YYYYMMDD = GetYYYYMMDD();
def yesterdaytest = if YYYYMMDD != YYYYMMDD[1] then YYYYMMDD[1] else yesterdaytest[1];
#plot tester = if getday() >= yesterdaytest and SecondsTillTime(1600)!=0 then 1 else 0;
def ORActive = if start == start.premarket
#then if ORActive[1] == 0 #and
#GetYYYYMMDD() != GetYYYYMMDD()[1]
#then 1
then if #ORActive[1] == 1 or
GetTime() <= RegularTradingend(getyyyymmdd())
#GetTime() <= regulartradingend(yesterdaytest)
#GetTime() <= RegularTradingend(GetYYYYMMDD())
#and GetTime() > RegularTradingEnd(GetYYYYMMDD())
then 1
else 0
else 0;
def ORHigh = if ORHigh[1] == 0 or
ORActive[1] == 0 and
ORActive == 1
then high
else if ORActive and
high > ORHigh[1]
then high
else ORHigh[1];
plot ORH = if (ShowTodayOnly and
GetDay() != GetLastDay()) or
!ORActive
then Double.NaN
else if !onexpansion
then ORHigh
else Double.NaN;
ORH.SetDefaultColor(Color.GREEN);
ORH.SetStyle(Curve.MEDIUM_DASH);
ORH.SetLineWeight(1);
Here is a mod to an auto fib study that should work for you. The image shows the fibs, but you can turn them off at the input hide_fibs set to YES.
 Code:
Code:#Auto_Fib_Input_Time_Range_Developing input hide_fibs = no; input start = 1600; input end = 1600; input ShowLast_x_ranges = No; input X_ranges = 1; def ymd = GetYYYYMMDD(); def na = Double.NaN; def bn = BarNumber(); def sec1 = SecondsFromTime(start); def sec2 = SecondsFromTime(end); def isTime1 = (sec1 >= 0 and sec1[1] < 0) or (sec1 < sec1[1] and sec1 >= 0); def isTime2 = (sec2 >= 0 and sec2[1] < 0) or (sec2 < sec2[1] and sec2 >= 0); def inRange = CompoundValue(1, if isTime1 then 1 else if isTime2 then 0 else inRange[1], 0); def lastbn = HighestAll(if IsNaN(close[-1]) then bn else na); def rhi = if isnan(close) then rhi[1] else if sec1[1]<0 and sec1>=0 then high else if inRange == 1 then Max(high, rhi[1]) else rhi[1]; def rlo = if isnan(close) then rlo[1] else if sec1[1]<0 and sec1>=0 then low else if inRange == 1 then Min(low, rlo[1]) else rlo[1]; def rangecount = if ymd != ymd[1] then rangecount[1] + 1 else rangecount[1]; def x_breakcount = HighestAll(rangecount) - rangecount + 1; input showtimerange_label = yes; AddLabel(showtimerange_label, "HL Time Range: " + AsPrice(start) + " to " + AsPrice(end), Color.YELLOW); input Fpos236 = .236; input Fpos382 = .382; input Fpos50 = .5; input Fpos618 = .618; input Fpos764 = .764; def range = rhi - rlo; def F236 = rhi - (range * Fpos236); def F382 = rhi - (range * Fpos382); def F50 = rhi - (range * Fpos50); def F618 = rhi - (range * Fpos618); def F764 = rhi - (range * Fpos764); plot ORH; plot ORL; plot Fib50; plot Fib236; plot Fib382; plot Fib618; plot Fib764; if ShowLast_x_ranges and x_breakcount > X_ranges then { ORH = Double.NaN; ORL = Double.NaN; Fib50 = Double.NaN; Fib236 = Double.NaN; Fib382 = Double.NaN; Fib618 = Double.NaN; Fib764 = Double.NaN; } else { ORH = rhi; ORL = rlo; Fib50 = F50; Fib236 = F236; Fib382 = F382; Fib618 = F618; Fib764 = F764; } ORH.SetDefaultColor(Color.WHITE); ORH.SetStyle(Curve.LONG_DASH); ORH.SetLineWeight(2); ORL.SetDefaultColor(Color.WHITE); ORL.SetStyle(Curve.LONG_DASH); ORL.SetLineWeight(2); Fib50.SetDefaultColor(Color.WHITE); Fib50.SetStyle(Curve.LONG_DASH); Fib50.SetLineWeight(1); Fib50.Sethiding(hide_fibs); Fib236.SetDefaultColor(Color.CYAN); Fib236.SetStyle(Curve.LONG_DASH); Fib236.SetLineWeight(1); Fib236.Sethiding(hide_fibs); Fib382.SetDefaultColor(Color.YELLOW); Fib382.SetStyle(Curve.LONG_DASH); Fib382.SetLineWeight(1); Fib382.Sethiding(hide_fibs); Fib618.SetDefaultColor(Color.YELLOW); Fib618.SetStyle(Curve.LONG_DASH); Fib618.SetLineWeight(1); Fib618.Sethiding(hide_fibs); Fib764.SetDefaultColor(Color.CYAN); Fib764.SetStyle(Curve.LONG_DASH); Fib764.SetLineWeight(2); Fib764.Sethiding(hide_fibs); input showbubbles = yes; input bubblemover = 5; def mo = bubblemover; def mo1 = mo + 1; AddChartBubble(showbubbles and bn==highestall(bn - mo1), ORH[mo1], "H", ORH.TakeValueColor()); AddChartBubble(showbubbles and hide_fibs == no and bn==highestall(bn - mo1), Fib236[mo1], "23.6", Fib236.TakeValueColor()); AddChartBubble(showbubbles and hide_fibs == no and bn==highestall(bn - mo1), Fib382[mo1], "38.2", Fib382.TakeValueColor()); AddChartBubble(showbubbles and hide_fibs == no and bn==highestall(bn - mo1), Fib50[mo1], "50", Fib50.TakeValueColor()); AddChartBubble(showbubbles and hide_fibs == no and bn==highestall(bn - mo1), Fib618[mo1], "61.8", Fib618.TakeValueColor()); AddChartBubble(showbubbles and hide_fibs == no and bn==highestall(bn - mo1), Fib764[mo1], "76.4", Fib764.TakeValueColor()); AddChartBubble(showbubbles and bn==highestall(bn - mo1), ORL[mo1], "L", ORL.TakeValueColor(), no);
Join useThinkScript to post your question to a community of 21,000+ developers and traders.
| Thread starter | Similar threads | Forum | Replies | Date |
|---|---|---|---|---|
| D | RSI with On Balance Volume OBV For ThinkorSwim? | Indicators | 8 | |
|
|
Balance of Power Trend Indicator for ThinkorSwim | Indicators | 34 | |
|
|
Repaints Cup and Handle Indicator for ThinkorSwim | Indicators | 25 | |
|
|
The Ultimate Buy and Sell Indicator for ThinkOrSwim | Indicators | 6 | |
| J | ATR Expected Move Indicator For ThinkOrSwim | Indicators | 17 |
Similar threads
Not the exact question you're looking for?
Start a new thread and receive assistance from our community.
87k+
Posts
1628
Online
Similar threads
Similar threads
The Market Trading Game Changer
Join 2,500+ subscribers inside the useThinkScript VIP Membership Club
- Exclusive indicators
- Proven strategies & setups
- Private Discord community
- ‘Buy The Dip’ signal alerts
- Exclusive members-only content
- Add-ons and resources
- 1 full year of unlimited support
Frequently Asked Questions
What is useThinkScript?
useThinkScript is the #1 community of stock market investors using indicators and other tools to power their trading strategies. Traders of all skill levels use our forums to learn about scripting and indicators, help each other, and discover new ways to gain an edge in the markets.
How do I get started?
We get it. Our forum can be intimidating, if not overwhelming. With thousands of topics, tens of thousands of posts, our community has created an incredibly deep knowledge base for stock traders. No one can ever exhaust every resource provided on our site.
If you are new, or just looking for guidance, here are some helpful links to get you started.
- The most viewed thread:
https://usethinkscript.com/threads/repainting-trend-reversal-for-thinkorswim.183/ - Our most popular indicator:
https://usethinkscript.com/threads/buy-the-dip-indicator-for-thinkorswim.3553/ - Answers to frequently asked questions:
https://usethinkscript.com/threads/answers-to-commonly-asked-questions.6006/
What are the benefits of VIP Membership?
VIP members get exclusive access to these proven and tested premium indicators: Buy the Dip, Advanced Market Moves 2.0, Take Profit, and Volatility Trading Range. In addition, VIP members get access to over 50 VIP-only custom indicators, add-ons, and strategies, private VIP-only forums, private Discord channel to discuss trades and strategies in real-time, customer support, trade alerts, and much more. Learn all about VIP membership here.
How can I access the premium indicators?
To access the premium indicators, which are plug and play ready, sign up for VIP membership here.