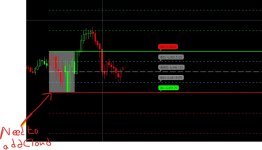
Initial Balance Indicator for ThinkorSwim

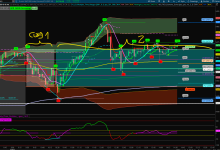
Here is a mod to an auto fib study that should work for you. The image shows the fibs, but you can turn them off at the input hide_fibs set to YES.
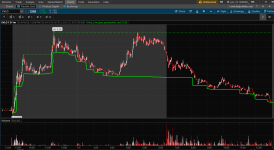
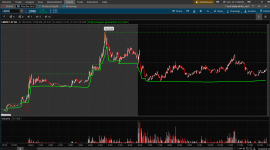
Is there any way to modify this to include a moving lod line? If the new hod > current hod then it becomes a new starting point for the low. If the current hod is < the hod, then the lod line continues off of that line. Basically every point of the lod line is derived from where the nhod is from the current day. Pictures included below.
 

Attachments

  • 1.png
    1.png
    226.6 KB · Views: 220
  • 2.png
    2.png
    242.6 KB · Views: 219
The IB indicator plots on all charts but not on SPX. Anyone else has the same problem? Thanks

If you are referring to the scripts that I posted, to make lines plot from the beginning times, the volumeprofile indicator was used. Since TOS SPX does not have volume, the indicator will not work.
 
Sorry, just saw this

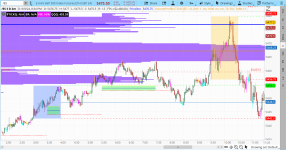
This should start plotting the developing opening range at the times input. It will use two clouds to distinguish the opening range from the extended one.
hi @SleepyZ, I just installed this indicator, and I was wondering if you could add the option to activate the clouds separately, like showing cloud 1 (no/yes) and cloud 2 (no/yes), thank you.
 

Attachments

  • Screenshot 2024-08-14 _Initial_Balance.png
    Screenshot 2024-08-14 _Initial_Balance.png
    222.3 KB · Views: 137
hi @SleepyZ, I just installed this indicator, and I was wondering if you could add the option to activate the clouds separately, like showing cloud 1 (no/yes) and cloud 2 (no/yes), thank you.

I added this code to the full code.
input show_cloud_1 = yes;
input show_cloud_2 = yes;

AddCloud(if showclouds and show_cloud_1 then r(otime1, ctime1, extend = no, showlastonly = showlastonly) else Double.NaN, r(otime1, ctime1, extend = no, showlastonly = showlastonly).lrange, GlobalColor("OR"), GlobalColor("OR"));
AddCloud(if showclouds and show_cloud_2 and SecondsFromTime(ctime1) >= 0 then r(otime1, ctime1, ex

I left the input showclouds so that these can both turned off/on at once.

The full code is below and is replaced in post # 32

Code:
#OpeningRange_Developing_in_Separate_Cloud_Color
script r {
    input oTime = 2300;
    input cTime = 0500;
    input extend = yes;
    input showlastonly = yes;

    def sec1 = SecondsFromTime(oTime);
    def sec2 = SecondsFromTime(cTime);
    def isTime1 = (sec1 >= 0 and sec1[1] < 0) or (sec1 < sec1[1] and sec1 >= 0);
    def isTime2 = (sec2 >= 0 and sec2[1] < 0) or (sec2 < sec2[1] and sec2 >= 0);
    def inRange = CompoundValue(1, if isTime1 then 1 else if isTime2 then 0 else inRange[1], 0);
    def bars   = 200000;

    input pricePerRowHeightMode = { AUTOMATIC, default TICKSIZE, CUSTOM};
    input customRowHeight = 1.0;
    input timePerProfile = {default BAR};
    input onExpansion = no;
    input profiles = 1000;

    def period;

    switch (timePerProfile) {
    case BAR:
        period = BarNumber() - 1;
}


    def count = CompoundValue(1, if inRange and period != period[1] then (count[1] + period - period[1]) % bars else count[1], 0);
    def cond = count < count[1] + period - period[1];
    def height;
    switch (pricePerRowHeightMode) {
    case AUTOMATIC:
        height = PricePerRow.AUTOMATIC;
    case TICKSIZE:
        height = PricePerRow.TICKSIZE;
    case CUSTOM:
        height = customRowHeight;
}

    profile vol = VolumeProfile("startNewProfile" = cond, "onExpansion" = no, "numberOfProfiles" = 1000, "pricePerRow" = height, "value area percent" = 0);
    def con = CompoundValue(1, onExpansion, no);

    def hProfile = if inRange and IsNaN(vol.GetHighest()) and con then hProfile[1] else vol.GetHighest();
    def lProfile = if inRange and IsNaN(vol.GetLowest()) and con then lProfile[1] else vol.GetLowest();
    def plotsDomain = IsNaN(close) == onExpansion;
    def ProfileHigh = if inRange and plotsDomain then hProfile else if extend then ProfileHigh[1] else Double.NaN;
    def ProfileLow  = if inRange and plotsDomain then lProfile else if extend then ProfileLow[1] else Double.NaN;

    def dataCount = CompoundValue(1, if cond != cond[1] then dataCount[1] + 1 else dataCount[1]  , 0);

    plot hrange = if !showlastonly then ProfileHigh else if showlastonly and  HighestAll(dataCount) - dataCount <= if cTime <= 0000 then 2 else 1  then ProfileHigh else Double.NaN;
    plot lrange = if !showlastonly then ProfileLow else if showlastonly and HighestAll(dataCount) - dataCount <= if cTime <= 0000 then 2 else 1  then ProfileLow else Double.NaN;
}

input showclouds = yes;
input showbubbles = yes;
input showbubble_times = yes;
input showlastonly = yes;

input otime1 = 0930;
input ctime1 = 1030;

#Horizontal Lines - Separate input for line_extend was necessary as request was for extended lines, whereas the clouds were not wanted to extend by the times input

input line_extend = yes;
plot r1h = r(otime1, ctime1, extend = line_extend, showlastonly = showlastonly);
plot r1l = r(otime1, ctime1, extend = line_extend, showlastonly = showlastonly).lrange;
plot mid = (r1h + r1l) / 2;


DefineGlobalColor("H", Color.LIGHT_GREEN);
DefineGlobalColor("L", Color.LIGHT_RED);

r1h.SetPaintingStrategy(PaintingStrategy.HORIZONTAL);
r1l.SetPaintingStrategy(PaintingStrategy.HORIZONTAL);


r1h.SetDefaultColor(GlobalColor("H"));
r1l.SetDefaultColor(GlobalColor("L"));


#Clouds - Cloud plots for cloud1-3 hl are needed

input cloud_extend = no;
plot cloud1h = r(otime1, ctime1, extend = cloud_extend, showlastonly = showlastonly);
plot cloud1l = r(otime1, ctime1, extend = cloud_extend, showlastonly = showlastonly).lrange;

DefineGlobalColor("OR", Color.WHITE);
DefineGlobalColor("OR EXT", Color.CYAN);
input show_cloud_1 = yes;
input show_cloud_2 = yes;
AddCloud(if showclouds and show_cloud_1 then r(otime1, ctime1, extend = no, showlastonly = showlastonly) else Double.NaN, r(otime1, ctime1, extend = no, showlastonly = showlastonly).lrange, GlobalColor("OR"), GlobalColor("OR"));
AddCloud(if showclouds and show_cloud_2 and SecondsFromTime(ctime1) >= 0 then r(otime1, ctime1, extend = yes, showlastonly = showlastonly) else Double.NaN, r(otime1, ctime1, extend = yes, showlastonly = showlastonly).lrange, GlobalColor("OR EXT"), GlobalColor("OR EXT"));

input bubblemover = 5;
def b  = bubblemover;
def b1 = b + 1;
def mover = showbubbles and IsNaN(close[b]) and !IsNaN(close[b1]);

AddChartBubble(mover, r1h[b1],
if showbubble_times then AsPrice(otime1) + " : " + AsPrice(ctime1) + "\nH: " + AsText(r1h) else "H: " + AsText(r1h), r1h.TakeValueColor());
AddChartBubble(mover, r1l,
if showbubble_times then AsPrice(otime1) + " : " + AsPrice(ctime1) + "\nL: " + AsText(r1l) else "L: " + AsText(r1l),  r1l.TakeValueColor(), up = no);
AddChartBubble(mover, mid,
if showbubble_times then AsPrice(otime1) + " : " + AsPrice(ctime1) + "\nM: " + AsText(mid) else "M: " + AsText(mid),  mid.TakeValueColor(), up = no);

#
 
Sorry, just saw this question.

The above seems to work on /ES with or without extended hours enabled

Here are 2 charts without extended hours in the upper chart and with extended hours in the lower chart, both for /ES 1m charts
Thank you for your willingness to support our community with such great work @SleepyZ .

I duplicate this script so i can see both the London and NY opening ranges, however i want to add the 10:00-2:00am hours as a range i'd like to have highlighted and it does not print.

If i shorten the time to start at midnight and end at 2:00am it plots successfully just like the others. or from 10:pm to 23:59

is there a way to modify the code so that i can see ranges that start before midnight and extend after?

e.g 10:00pm - 2:00am or 11:00pm to 3:00am?

I appreciate you sooo much for any help you can provide to get that functionality working.
 

Attachments

  • Sessions.png
    Sessions.png
    77.5 KB · Views: 73
Thank you for your willingness to support our community with such great work @SleepyZ .

I duplicate this script so i can see both the London and NY opening ranges, however i want to add the 10:00-2:00am hours as a range i'd like to have highlighted and it does not print.

If i shorten the time to start at midnight and end at 2:00am it plots successfully just like the others. or from 10:pm to 23:59

is there a way to modify the code so that i can see ranges that start before midnight and extend after?

e.g 10:00pm - 2:00am or 11:00pm to 3:00am?

I appreciate you sooo much for any help you can provide to get that functionality working.

Try using input otime1 = 2200 and input ctime1 = 0200. Thinkscript code uses Eastern Time Zne times using a 2400 hour clock.

Thank you for the kind words!

Screenshot 2024-09-27 071159.jpg
 

Join useThinkScript to post your question to a community of 21,000+ developers and traders.

Similar threads

Not the exact question you're looking for?

Start a new thread and receive assistance from our community.

87k+ Posts
265 Online
Create Post

Similar threads

Similar threads

The Market Trading Game Changer

Join 2,500+ subscribers inside the useThinkScript VIP Membership Club
  • Exclusive indicators
  • Proven strategies & setups
  • Private Discord community
  • ‘Buy The Dip’ signal alerts
  • Exclusive members-only content
  • Add-ons and resources
  • 1 full year of unlimited support

Frequently Asked Questions

What is useThinkScript?

useThinkScript is the #1 community of stock market investors using indicators and other tools to power their trading strategies. Traders of all skill levels use our forums to learn about scripting and indicators, help each other, and discover new ways to gain an edge in the markets.

How do I get started?

We get it. Our forum can be intimidating, if not overwhelming. With thousands of topics, tens of thousands of posts, our community has created an incredibly deep knowledge base for stock traders. No one can ever exhaust every resource provided on our site.

If you are new, or just looking for guidance, here are some helpful links to get you started.

What are the benefits of VIP Membership?
VIP members get exclusive access to these proven and tested premium indicators: Buy the Dip, Advanced Market Moves 2.0, Take Profit, and Volatility Trading Range. In addition, VIP members get access to over 50 VIP-only custom indicators, add-ons, and strategies, private VIP-only forums, private Discord channel to discuss trades and strategies in real-time, customer support, trade alerts, and much more. Learn all about VIP membership here.
How can I access the premium indicators?
To access the premium indicators, which are plug and play ready, sign up for VIP membership here.
Back
Top