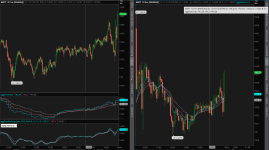
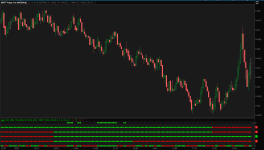
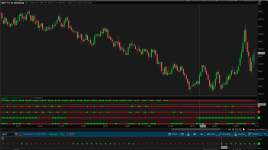
Folks, given the recent interest in the MTF SuperTrend, I have modified the study that
@SmellyCat posted earlier
Essentially removed the script function component and replaced it with what I term "standard" code
Ran it on a 1 min chart of MSFT and it does yield different results.
# SuperTrend Multiple Time Frames
# Mobius with mods by tomsk to replace the script() function for secondary aggs with "standard" code
# V03.01.2016
# 11.4.2019

declare lower;

input agg1 = AggregationPeriod.Five_Min;
input agg2 = AggregationPeriod.Ten_Min;
input agg3 = AggregationPeriod.Fifteen_Min;
input agg4 = AggregationPeriod.Thirty_Min;
input agg5 = AggregationPeriod.Hour;
input AtrMult = .70;
input nATR = 4;
input AvgType = AverageType.HULL;

def Fh = FundamentalType.High;
def Fl = FundamentalType.Low;
def Fc = FundamentalType.Close;
def Fhl2 = FundamentalType.HL2;

def cl = close;
def x = isNaN(cl[2]) and !isNaN(cl[3]);
def ATR = MovingAverage(AvgType, TrueRange(high, close, low), nATR);
def UP = hl2 + (AtrMult * ATR);
def DN = hl2 + (-AtrMult * ATR);
def S = if close < S[1]
        then Round(UP / tickSize(), 0) * tickSize()
        else Round(DN / tickSize(), 0) * tickSize();
def FirstAgg = if close > S then 1 else 0;
plot FirstAggPlot = if isNaN(cl)
                    then double.nan
                    else 1;
FirstAggPlot.SetStyle(Curve.Points);
FirstAggPlot.SetLineWeight(3);
FirstAggPlot.AssignValueColor(if FirstAgg == 1
                              then color.green
                              else color.red);
AddChartBubble(x, 1, (GetAggregationPeriod()/1000/60) + " min", color.white, yes);

# SecondAgg
def h2 = Fundamental(Fh, period = agg2)[1];
def l2 = Fundamental(Fl, period = agg2)[1];
def c2 = Fundamental(Fc, period = agg2)[1];
def hl2 = Fundamental(Fhl2, period = agg2)[1];
def ATR2 = MovingAverage(AvgType, TrueRange(h2, c2, l2), nATR);
def UP2 = hl2 + (AtrMult * ATR2);
def DN2 = hl2 + (-AtrMult * ATR2);
def S2 = if c2 < S2[1]
         then Round(UP2 / tickSize(), 0) * tickSize()
         else Round(DN2 / tickSize(), 0) * tickSize();
def SecondAgg = if c2 > S2 then 1 else 0;
plot SecondAggPlot = if isNaN(cl)
                     then double.nan
                     else 2;
SecondAggPlot.SetStyle(Curve.Points);
SecondAggPlot.SetLineWeight(3);
SecondAggPlot.AssignValueColor(if SecondAgg == 1
                               then color.green
                               else color.red);
AddChartBubble(x, 2, (agg2/1000/60) + " min", color.white, yes);

# ThirdAgg
def h3 = Fundamental(Fh, period = agg3)[1];
def l3 = Fundamental(Fl, period = agg3)[1];
def c3 = Fundamental(Fc, period = agg3)[1];
def hl3 = Fundamental(Fhl2, period = agg3)[1];
def ATR3 = MovingAverage(AvgType, TrueRange(h3, c3, l3), nATR);
def UP3 = hl3 + (AtrMult * ATR3);
def DN3 = hl3 + (-AtrMult * ATR3);
def S3 = if c3 < S3[1]
         then Round(UP3 / tickSize(), 0) * tickSize()
         else Round(DN3 / tickSize(), 0) * tickSize();
def ThirdAgg = if c3 > S3 then 1 else 0;
plot ThirdAggPlot = if isNaN(cl)
                    then double.nan
                    else 3;
ThirdAggPlot.SetStyle(Curve.Points);
ThirdAggPlot.SetLineWeight(3);
ThirdAggPlot.AssignValueColor(if ThirdAgg == 1
                              then color.green
                              else color.red);
AddChartBubble(x, 3, (agg3/1000/60) + " min", color.white, yes);

# FourthAgg
def h4 = Fundamental(Fh, period = agg4)[1];
def l4 = Fundamental(Fl, period = agg4)[1];
def c4 = Fundamental(Fc, period = agg4)[1];
def hl4 = Fundamental(Fhl2, period = agg4)[1];
def ATR4 = MovingAverage(AvgType, TrueRange(h4, c4, l4), nATR);
def UP4 = hl4 + (AtrMult * ATR4);
def DN4 = hl4 + (-AtrMult * ATR4);
def S4 = if c4 < S4[1]
         then Round(UP4 / tickSize(), 0) * tickSize()
         else Round(DN4 / tickSize(), 0) * tickSize();
def FourthAgg = if c4 > S4 then 1 else 0;
plot FourthAggPlot = if isNaN(cl)
                     then double.nan
                     else 4;
FourthAggPlot.SetStyle(Curve.Points);
FourthAggPlot.SetLineWeight(3);
FourthAggPlot.AssignValueColor(if FourthAgg == 1
                               then color.green
                               else color.red);
AddChartBubble(x, 4, (agg4/1000/60) + " min", color.white, yes);

# FifthAgg
def h5 = Fundamental(Fh, period = agg5)[1];
def l5 = Fundamental(Fl, period = agg5)[1];
def c5 = Fundamental(Fc, period = agg5)[1];
def hl5 = Fundamental(Fhl2, period = agg5)[1];
def ATR5 = MovingAverage(AvgType, TrueRange(h5, c5, l5), nATR);
def UP5 = hl5 + (AtrMult * ATR5);
def DN5 = hl5 + (-AtrMult * ATR5);
def S5 = if c5 < S5[1]
         then Round(UP5 / tickSize(), 0) * tickSize()
         else Round(DN5 / tickSize(), 0) * tickSize();
def FifthAgg = if c5 > S5 then 1 else 0;
plot FifthAggPlot = if isNaN(cl)
                    then double.nan
                    else 5;
FifthAggPlot.SetStyle(Curve.Points);
FifthAggPlot.SetLineWeight(3);
FifthAggPlot.AssignValueColor(if FifthAgg == 1
                              then color.green
                              else color.red);
AddChartBubble(x, 5, (agg5/1000/60)+ " min", color.white, yes);
plot Six = if isNaN(cl)
           then double.nan
           else 6;
Six.SetStyle(Curve.Points);
Six.SetLineWeight(3);
Six.AssignValueColor(if FirstAgg and
                        SecondAgg and
                        ThirdAgg and
                        FourthAgg and
                        FifthAgg
                     then color.green
                     else if !FirstAgg and
                             !SecondAgg and
                             !ThirdAgg and
                             !FourthAgg and
                             !FifthAgg
                          then color.red
                     else color.black);
# End Code ST MTF

") - I was troubleshooting the use of agg when leveraging the thinkscript function keyword "script". Best!
- I was troubleshooting the use of agg when leveraging the thinkscript function keyword "script". Best!