
Camelotnite
New member
mod note:
IV Rank and IV Percentile are widely used in options trading to evaluate whether implied volatility is relatively high or low compared to its own historical context. This helps traders assess premium richness, mean‑reversion potential, and whether conditions favor selling or buying volatility.
Display Notes
• This script is designed for DAILY charts only.
• A warning label appears if used on intraday timeframes.
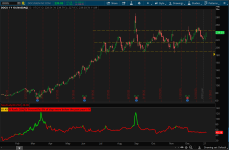
• The IV line is colored green when IV Rank > 50%, otherwise red.
• Some futures symbols use ETF‑based IV proxies (labeled accordingly).
---------------------------------------------------
As new member to this forum. Thought I share this IV rank indicator for ThinkorSwim that helps me increase probability of success. This script was taken from tastytrade. The rule is to sell premiums that are at least above 50% IV rank. You can watch this video to find out more https://www.tastylive.com/shows/the...nk-and-iv-percentile-w-thinkscript-11-12-2015

IV (Implied Volatility)
IV Rank
A high IV Rank means current IV is near the top of its yearly range.
A low IV Rank means current IV is near the bottom.
The label turns green when IV Rank > 50%, otherwise red.
IV Percentile
IV Percentile measures how often, over the past year, daily IV readings were BELOW today’s IV. It answers the question:
“On what percentage of days was IV lower than it is now?”
Example:
• IV Percentile = 80% → IV has been lower on 80% of the past 252 days.
Notes from Mobius:
IV Rank and IV Percentile are widely used in options trading to evaluate whether implied volatility is relatively high or low compared to its own historical context. This helps traders assess premium richness, mean‑reversion potential, and whether conditions favor selling or buying volatility.
Display Notes
• This script is designed for DAILY charts only.
• A warning label appears if used on intraday timeframes.
• The IV line is colored green when IV Rank > 50%, otherwise red.
• Some futures symbols use ETF‑based IV proxies (labeled accordingly).
---------------------------------------------------
As new member to this forum. Thought I share this IV rank indicator for ThinkorSwim that helps me increase probability of success. This script was taken from tastytrade. The rule is to sell premiums that are at least above 50% IV rank. You can watch this video to find out more https://www.tastylive.com/shows/the...nk-and-iv-percentile-w-thinkscript-11-12-2015
IV (Implied Volatility)
retrieves the current implied volatility for the symbol.
For futures, it automatically substitutes the appropriate volatility
index or ETF proxy (e.g., VIX for /ES, OIV for /CL, GVX for /GC, etc.).
IV Rank
measures where today’s IV sits relative to its own 1‑year range.
IV Rank = (Current IV – 1‑year IV Low) / (1‑year IV High – Low)A high IV Rank means current IV is near the top of its yearly range.
A low IV Rank means current IV is near the bottom.
The label turns green when IV Rank > 50%, otherwise red.
IV Percentile
IV Percentile measures how often, over the past year, daily IV readings were BELOW today’s IV. It answers the question:
“On what percentage of days was IV lower than it is now?”
Example:
• IV Percentile = 80% → IV has been lower on 80% of the past 252 days.
Code:
#
# tastytrade/dough Research Team
# Michael Rechenthin, Ph.D.
# Follow me on twitter:  @mrechenthin
#
# IV Rank is a description of where the current IV lies in comparison
# to its yearly high and low IV
#
# IV Percentile gives the percentage of days over the last year, that
# were below the current IV.  If the IV Rank is above 50%, then
# the script will highlight it green; otherwise red.
#
# For information on the two, see Skinny on Options Data Science,
# titled "IV Rank and IV Percentile (w/ thinkscript)" on Nov 12, 2015
# http://ontt.tv/1Nt4fcS
#
# version 3.2
#
declare lower;
declare hide_on_intraday; # do not display when using intra-day plots
input days_back = 252; # it is most common to use 1-year (or 252 trading days)
def x;
if GetAggregationPeriod() > AggregationPeriod.DAY {
x=1;
} else {
x=2;
}
AddLabel(yes, if (x==1) then "This script should be used on daily charts only" else "");
# implied volatility
# using proxies for futures
def df = if (GetSymbol() == "/ES") then close("VIX") / 100
else if (GetSymbol() == "/CL") then close("OIV") / 100
else if (GetSymbol() == "/GC") then close("GVX") / 100
else if (GetSymbol() == "/SI") then close("VXSLV") / 100
else if (GetSymbol() == "/NQ") then close("VXN") / 100
else if (GetSymbol() == "/TF") then close("RVX") / 100
else if (GetSymbol() == "/YM") then close("VXD") / 100
else if (GetSymbol() == "/6E") then close("EVZ") / 100
else if (GetSymbol() == "/6J") then close("JYVIX") / 100
else if (GetSymbol() == "/6B") then close("BPVIX") / 100
else if (GetSymbol() == "/ZN") then close("TYVIX") / 100
else if (Getsymbol() == "/ZW") then close("WIV") / 100
else if (Getsymbol() == "/ZB") then imp_volatility("TLT")
else if (Getsymbol() == "/ZC") then imp_volatility("CORN")
else if (Getsymbol() == "/ZS") then imp_volatility("SOYB")
else if (Getsymbol() == "/KC") then imp_volatility("JO")
else if (Getsymbol() == "/NG") then imp_volatility("UNG")
else if (Getsymbol() == "/6S") then imp_volatility("FXF")
else imp_volatility();
def df1 = if !IsNaN(df) then df else df[-1];
# display regular implied volatility
# ---------------------------
AddLabel(yes, "IV: " + Round(df1 * 100.0, 0), Color.ORANGE);
# calculate the IV rank
# ---------------------------
# calculate the IV rank
def low_over_timespan = Lowest(df1, days_back);
def high_over_timespan = Highest(df1, days_back);
def iv_rank = Round( (df1 - low_over_timespan) / (high_over_timespan - low_over_timespan) * 100.0, 0);
AddLabel(yes, "IV Rank: " + iv_rank + "%", if iv_rank > 50 then Color.GREEN else Color.RED);
# calculate the IV percentile
# ---------------------------
# how many times over the past year, has IV been below the current IV
def counts_below = fold i = 1 to days_back + 1 with count = 0
do
  if df1[0] > df1 then
    count + 1
  else
    count;
def iv_percentile = Round(counts_below / days_back * 100.0, 0);
plot IVs = df1 * 100;
IVs.SetLineWeight(3);
IVs.AssignValueColor(if iv_rank > 50 then Color.GREEN else Color.RED);
AddLabel(yes, "IV Percentile: " + iv_percentile + "% of days were below the past year's IV", if iv_percentile > 50 then Color.GREEN else Color.RED);
# thanks to Kevin Osborn for the following line
AddLabel(yes, if (GetSymbol() == "/6S" or GetSymbol() == "/ZB" or GetSymbol() == "/ZC" or GetSymbol() == "/NG" or GetSymbol() == "/ZS" or GetSymbol() == "/KC") then "* ETF based" else "", Color.BLACK);
Notes from Mobius:
11:25 Just to be clear Rank and Percentile are NOT the same thing. Rank is where the current value is in comparison to a length of times high and low. Percentile measures the percentage of time data was below a current value.
Attachments
Last edited by a moderator: