Implied Volatility (IV) Rank & Percentile for ThinkorSwim

Camelotnite

New member
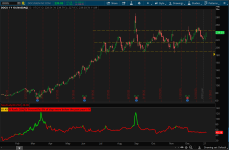
As new member to this forum. Thought I share this IV rank indicator for ThinkorSwim that helps me increase probability of success. This script was taken from tastytrade. The rule is to sell premiums that are at least above 50% IV rank. You can watch this video to find out more https://uat.tastytrade.com/tt/shows...nk-and-iv-percentile-w-thinkscript-11-12-2015

AnhUeXm.png


Code:
# ------------------------START BELOW THIS LINE--------------------------

#

# tastytrade/dough Research Team

# Michael Rechenthin, Ph.D.

# Follow me on twitter:  @mrechenthin

#

# IV Rank is a description of where the current IV lies in comparison

# to its yearly high and low IV

#

# IV Percentile gives the percentage of days over the last year, that

# were below the current IV.  If the IV Rank is above 50%, then

# the script will highlight it green; otherwise red.

#

# For information on the two, see Skinny on Options Data Science,

# titled "IV Rank and IV Percentile (w/ thinkscript)" on Nov 12, 2015

# http://ontt.tv/1Nt4fcS

#

# version 3.2

#

declare lower;

declare hide_on_intraday; # do not display when using intra-day plots

input days_back = 252; # it is most common to use 1-year (or 252 trading days)


def x;

if GetAggregationPeriod() > AggregationPeriod.DAY {

x=1;

} else {

x=2;

}

AddLabel(yes, if (x==1) then "This script should be used on daily charts only" else "");


# implied volatility

# using proxies for futures

def df = if (GetSymbol() == "/ES") then close("VIX") / 100

else if (GetSymbol() == "/CL") then close("OIV") / 100

else if (GetSymbol() == "/GC") then close("GVX") / 100

else if (GetSymbol() == "/SI") then close("VXSLV") / 100

else if (GetSymbol() == "/NQ") then close("VXN") / 100

else if (GetSymbol() == "/TF") then close("RVX") / 100

else if (GetSymbol() == "/YM") then close("VXD") / 100

else if (GetSymbol() == "/6E") then close("EVZ") / 100

else if (GetSymbol() == "/6J") then close("JYVIX") / 100

else if (GetSymbol() == "/6B") then close("BPVIX") / 100

else if (GetSymbol() == "/ZN") then close("TYVIX") / 100

else if (Getsymbol() == "/ZW") then close("WIV") / 100

else if (Getsymbol() == "/ZB") then imp_volatility("TLT")

else if (Getsymbol() == "/ZC") then imp_volatility("CORN")

else if (Getsymbol() == "/ZS") then imp_volatility("SOYB")

else if (Getsymbol() == "/KC") then imp_volatility("JO")

else if (Getsymbol() == "/NG") then imp_volatility("UNG")

else if (Getsymbol() == "/6S") then imp_volatility("FXF")

else imp_volatility();


def df1 = if !IsNaN(df) then df else df[-1];


# display regular implied volatility

# ---------------------------

AddLabel(yes, "IV: " + Round(df1 * 100.0, 0), Color.ORANGE);


# calculate the IV rank

# ---------------------------

# calculate the IV rank

def low_over_timespan = Lowest(df1, days_back);

def high_over_timespan = Highest(df1, days_back);


def iv_rank = Round( (df1 - low_over_timespan) / (high_over_timespan - low_over_timespan) * 100.0, 0);


AddLabel(yes, "IV Rank: " + iv_rank + "%", if iv_rank > 50 then Color.GREEN else Color.RED);


# calculate the IV percentile

# ---------------------------

# how many times over the past year, has IV been below the current IV

def counts_below = fold i = 1 to days_back + 1 with count = 0

do

  if df1[0] > df1 then

    count + 1

  else

    count;


def iv_percentile = Round(counts_below / days_back * 100.0, 0);

plot IVs = df1 * 100;

IVs.SetLineWeight(3);

IVs.AssignValueColor(if iv_rank > 50 then Color.GREEN else Color.RED);


AddLabel(yes, "IV Percentile: " + iv_percentile + "% of days were below the past year's IV", if iv_percentile > 50 then Color.GREEN else Color.RED);


# thanks to Kevin Osborn for the following line

AddLabel(yes, if (GetSymbol() == "/6S" or GetSymbol() == "/ZB" or GetSymbol() == "/ZC" or GetSymbol() == "/NG" or GetSymbol() == "/ZS" or GetSymbol() == "/KC") then "* ETF based" else "", Color.BLACK);


# ------------------------END ABOVE THIS LINE--------------------------

How to Scan for IV Rank in ThinkorSwim

This is an IV (Implied Volatility) rank scanner that you can use.

Code:
def IV = if isNaN(imp_Volatility())
         then IV[1]
         else imp_Volatility();
def IVrank = (fold i = 0 to 252
              with p
              do p + if IV > getValue(IV, i)
                     then 1
                     else 0) / 252;
plot cond = IVrank > .9;

Notes from Mobius:

11:25 Just to be clear Rank and Percentile are NOT the same thing. Rank is where the current value is in comparison to a length of times high and low. Percentile measures the percentage of time data was below a current value.
 

Attachments

  • AnhUeXm.png
    AnhUeXm.png
    158.1 KB · Views: 436
Last edited by a moderator:
Is there an actual post for the IV PERCENTILE code? Most of the IV post seem to be for IV RANK. A lot of people confuse IV Rank for IV Percentile. IV Rank just uses the IV High and Low in the calculations. While IV Percentile uses the counts the number of IVs for each day (or period you choose) that are below the current IV for the day. For Example if the IVs were 0, 10,20,60, 20,15,50,30,45,100. And today's IV was 60 , the IV Rank would be 50, but the IV Percentile would be 90, since for 9 days the IV was below 50.
 
On the watchlist if you click customize you can add columns like market cap price what ever. I want a custom column that shows the percent change in implied volatility from the day before. This way when I run a scan I can rank the results by the biggest change in IV from the day before. I tried cobbling a script from other studies and I tried googling for answers. But this one has me. And I'm a little slow. Thank you!
 
Code:
## OneNote Archive Name: IV Rank and IV Percentile Plots _TT
## Archive Section: Volatility
## Suggested Tos Name using JQ naming convention: IV_Rank_IV_Percentile_TT
## Archive Date: 10.22.2018
## Archive Notes:
## End OneNote Archive Header.  Script follows.

# tastytrade/dough
# m.r. v1.6
#
# plots both IV Rank and IV Percentile
#
# IV Rank is a description of where the current IV lies in comparison to its yearly high and low IV
# IV Percentile tells the percentage of days over the last year, that were below the current IV
#
# for information on the two, see Skinny on Options Data Science, titled "IV Rank and IV Percentile"
# http://ontt.tv/1Nt4fcS

declare lower;
declare hide_on_intraday;
input days_back = 252; # we usually do this over one year (252 trading days)

# implied volatility
# using proxies for futures
def df = if (GetSymbol() == "/ES") then close("VIX") / 100
else if (GetSymbol() == "/CL") then close("OIV") / 100
else if (GetSymbol() == "/GC") then close("GVX") / 100
else if (GetSymbol() == "/SI") then close("VXSLV") / 100
else if (GetSymbol() == "/NQ") then close("VXN") / 100
else if (GetSymbol() == "/TF") then close("RVX") / 100
else if (GetSymbol() == "/YM") then close("VXD") / 100
else if (GetSymbol() == "/6E") then close("EVZ") / 100
else if (GetSymbol() == “/6J”) then close(“JYVIX”) / 100
else if (GetSymbol() == “/6B”) then close(“BPVIX”) / 100
else if (GetSymbol() == “/ZB”) then close(“TLT”) / 100
else if (GetSymbol() == "/ZN") then close(“TYVIX”) / 100
else imp_volatility();


def df1 = if !IsNaN(df) then df else df[-1];

# display regular implied volatility
# ---------------------------
AddLabel(yes, "IV: " + Round(df1 * 100.0, 0), Color.ORANGE);

# calculate the IV rank
# ---------------------------
# calculate the IV rank
def low_over_timespan = Lowest(df1, days_back);
def high_over_timespan = Highest(df1, days_back);

def iv_rank = Round( (df1 - low_over_timespan) / (high_over_timespan - low_over_timespan) * 100.0, 0);
plot IVRank = iv_rank;
IVRank.SetDefaultColor(Color.GRAY);
AddLabel(yes, "IV Rank: " + iv_rank + " (i.e. our default metric for analyzing IV)", Color.GREEN);

# calculate the IV percentile
# ---------------------------
# how many times over the past year, has IV been below the current IV
def counts_below = fold i = 1 to days_back + 1 with count = 0
do
  if df1[0] > df1[i] then
    count + 1
  else
    count;

def iv_percentile = Round(counts_below / days_back * 100.0, 0);
plot IVPercentile = iv_percentile;
IVPercentile.SetDefaultColor(Color.GREEN);
AddLabel(yes, "IV Percentile: " + iv_percentile + " (i.e. " + iv_percentile + "% of days or " + counts_below + " days out of " + days_back + " days were below the current IV)", Color.GREEN);

AddCloud(iv_rank, iv_percentile, Color.PINK, Color.YELLOW);

#my edits for IVR 30 and 50 levels of when to put on Strangles
#Also added color and line weight settings
plot minRank =30;
minRank.SetLineWeight(2);
minRank.SetDefaultColor(color = Color.Red);
Plot midRank =50;
midRank.SetLineWeight(2);
midRank.SetDefaultColor(color = Color.LIGHT_GREEN);

#label to alert when IVR greater than 30 and 50

def minRankLevel = if iv_rank >minRank then Yes else No;

AddLabel(yes, "Sell Strangle: Green=Sell:  "  + minRankLevel + "",if iv_rank > minRank then Color.GREEN else if iv_rank < minRank then color.Light_Gray else color.LIGHT_GRAY);
 
Code:
# calculate the IV percentile
# ---------------------------
# how many times over the past year, has IV been below the current IV
def counts_below = fold i = 1 to days_back + 1 with count = 0
do
  if df1[0] > df1 then 
    count + 1
  else
    count;

def iv_percentile = Round(counts_below / days_back * 100.0, 0);
# plot IVPercentile = iv_percentile;
# IVPercentile.SetDefaultColor(Color.RED);
AddLabel(yes, "IV PCT: " + iv_percentile , Color.RED);

# AddCloud(iv_rank, iv_percentile, Color.PINK, Color.YELLOW);
 
Last edited by a moderator:
I am a newbie and searched around for a while to find a custom column to allow the sorting of Implied Volatility Rank in my scanner or watchlist. This optimizes my selling strategy to only the highest RANKED implied volatility regardless of their current volatility percentage because the two seem to not always go hand in hand like I assumed.

Here is the simple code I used to create the custom column using thinkscript. Hopefully, this will help someone.

Code:
def vol = Imp_Volatility();
#rec data = if !isNaN(vol) then vol else data[1];
def data = vol;
def hi = highest(data,252);
def lo = lowest(data,252);
def perct = round((data - lo)*100/ (hi - lo),0);
plot x = perct;

Here is another IV script

Code:
# IV_Rank - IMPLIED VOLATILITY RANK - Adds a colored label to the chart showing IV Rank
#
# This study simply places a label on the chart showing the current IV
# Rank, otherwise known as IV Percentile. In addition, the label is
# color-coded to hint at the IV Rank, where lower values appear red and
# higher values are green, suggesting greater premium available to be
# sold at a higher IV Rank.
#
# For a more complex presentation of IV Rank in the context of past implied
# volatility, see my other thinkScript: http://pastebin.com/0Vumd8Gt
#
# By: Chris Baker <[email protected]> @ChrisBaker97
# Latest version maintained at: http://pastebin.com/jRDkHvXE
# More thinkScripts at: http://pastebin.com/u/ChrisBaker97
#
# Credit goes to Allen Everhart (http://www.smalldoginvestor.com) for the
# original idea and implementation of IV Percentile as a chart label.
#
# Portions of this code are derived from the IV_percentile Scan tab
# thinkScript included with the thinkorswim platform by TD Ameritrade.
#
# This thinkScript is designed for use in the Charts tab.
#
# This work is licensed under the Creative Commons Attribution-ShareAlike
# 3.0 Unported License. To view a copy of this license, visit:
# http://creativecommons.org/licenses/by-sa/3.0/deed.en_US
#
# This version of the IV Rank study adds dynamic color-coding, for quick
# identification of high- or low-IV Rank. The code has also been
# streamlined for faster execution and ease of interpretation. There is
# also no need to specify a period for the study - the entire aggregation
# period on the chart is used.
#
# The user input brightness can range from 0 to 100 and controls the
# intensity of the plot's red-green color scheme. A lower brightness will
# show up better on a light background, and vice versa.
 
input brightness = 80 ;                 # overall brightness of IV display
 q
declare upper ;
declare hide_on_intraday ;              # IV shows N/A for intraday aggregations, so we hide it
 
def ivClean = if isNaN(impVolatility()) # if IV data doesn't exist for a particular period ...
    then ivClean[1]                     # ... set it to the previous value so it won't taint the hi/lo
    else impVolatility() * 100 ;
 
def ivHi = HighestAll(ivClean) ;        # highest IV over range
def ivLo =  LowestAll(ivClean) ;        # lowest IV over range
 
def ivRange = ivHi - ivLo ;             # IV range from low to high
 
def ivRank = Round( 100 * (ivClean - ivLo) / ivRange, 1) ;  # IV rank
 
# Define a color level from 0 to 255 based on current IV%
def level = ivRank * 2.55;
 
# Check bounds and convert brightness input to an intensity factor between 0.2 and 1.0
def intensity = if      brightness <   0 then 0.2
                else if brightness > 100 then 1.0
                else                          0.2 + (brightness * 0.008) ;
 
# Calculate red and green color levels (modified by intensity) for the color function
def rLvl = intensity * (255 - level) ;
def gLvl = intensity * (level) ;
 
# Add label, colored according to current IV Rank.
AddLabel(yes, "IV Rank: " + ivRank + "%", CreateColor(rLvl, gLvl, 0)) ;
 
Last edited by a moderator:
Can someone to help me to display some IVs in upper chart on Daily timeframe?
  • 52 week IV high
  • 52 week IV low
  • IV%
  • Current IV Percentile
  • VWAP value.
 
Folks,

How do i make this dynamic to auto redraw also i wanted this in the bottom graph like this.. any help in customizing this is greatly appreciated


Code:
# begin code for IV_percentile rank chart study at top ---- IV_perentile is below that

#HINT: IV percentile RANK is an indicator that compares current IV to the high-low IV range over a specific number of weeks.  \n\nIV percentile denotes whether option prices are currently high/low relative to "normal" ImpVolatility \n\n Therefore IV percentile rank and IV percentile can be used as a strategy selection tool.  \n\nFor example, select negative Vega strategies when IV percentile rank is high [red label], select positive Vega strategies when IV percentile rank is low [green label], select small positive or negative Vega strategies when IV percentile rank is neutral [light gray label].  \n.


declare upper;

input NumberOfWeeks = 52; #HINT NumberOfWeeks: 52= 1-year; 39= 9-months; 26= 6-months; 13= 3-months
input show_IV_percentile_rank_label = yes; #HINT show_IV_percentile_rank_label: Reminder, IV percentile RANK is an indicator that compares current IV to the high-low IV range over a specific number of weeks. \n\n If NumberOfWeeks is set to 52 then this number will be the same as bottom of Trade tab
input show_IV_percentile_label = yes; #HINT show_IV_percentile_label: Reminder, IV percentile denotes whether option prices are currently high/low relative "normal" ImpVolatility
input show_normal_IV_label = no; #HINT show_normal_IV_label: "normal" IV is the level where ImpVolatility spent most of its time over the past xx weeks.


def IV = if !IsNaN(imp_volatility(period = AggregationPeriod.DAY))
         then imp_volatility(period = AggregationPeriod.DAY)
         else IV[1];
;
def timePeriod = NumberOfWeeks * 4.85; #NOTE: 4.85 is used instead of 5 to account for market holiday weeks
def hi = Highest(IV, timePeriod);
def lo = Lowest(IV, timePeriod);
def perct = (IV - lo) * 100 / (hi - lo);

AddLabel(show_IV_percentile_rank_label, Concat(NumberOfWeeks + "-week IV Rank " + Round(perct, 2), " %"), if perct > 80
     then Color.RED
     else if perct < 40
     then (CreateColor(51, 204, 0))
     else Color.LIGHT_GRAY);
 
# end code -------------


# HINT: This IV percentile is NOT a 0 - 100 rank of where current IV is located within the 52-week high/low range for ImpVolatility.  Instead this IV percentile compares 52-weeks of ImpVolatility data to determine where current IV is located relative to "normal" ImpVolatility.
# Many times IV percentile rank will be same or similar to IV percentile, however, if there has been a spike high or spike low in the ImpVolatility high/low range that spike(s) can skew IV percentile rank causing current IV to appear lower or higher than actual realtive to "normal" IV


def TradingDays = if NumberOfWeeks == 52 then 252 else if NumberOfWeeks == 39 then 189 else if NumberOfWeeks == 26 then 126 else 63;

def IVperc = fold i = 0 to TradingDays
             with p = 0
             do if IV < GetValue(IV , -i, TradingDays)
                then IVperc[1] + 1
                else IVperc[1];

def normal_IV =  fold j = 0 to TradingDays
               with q = 0
               do if 1 == 1
                then normal_IV[1] + 1
                else normal_IV[1];

def IVpercentile = (IVperc / (TradingDays + 1)) * 100;

AddLabel(show_IV_percentile_label, NumberOfWeeks + "-week IV Percentile " + round(IVpercentile,2) + " %", if IVpercentile > 80
     then Color.RED
     else if IVpercentile < 40
     then (CreateColor(51, 204, 0))
     else Color.LIGHT_GRAY);

AddLabel(show_normal_IV_label, "normal IV = " + AsPercent(normal_IV / 1000), color.BLUE);
 
I was trying to write a version of this code that would plot IV Rank. Though, I run into problems when using this lower study chart script on symbols with less than 252 bars. It would not draw the entire plot for symbols like RBLX and COIN. What's preventing this from plotting correctly?


Code:
# IVR Plot from below
#
# For information on the two, see Skinny on Options Data Science,
# titled "IV Rank and IV Percentile (w/ thinkscript)" on Nov 12, 2015
# http://ontt.tv/1Nt4fcS
#
# version 3.2
#
declare lower;
declare hide_on_intraday; # do not display when using intra-day plots
input days_back = 252; # it is most common to use 1-year (or 252 trading days)
input ivr_target = 30;
input ivr_lower_limit = 13;

def x;
if GetAggregationPeriod() > AggregationPeriod.DAY {
x=1;
} else {
x=2;
}
AddLabel(yes, if (x==1) then "This script should be used on daily charts only" else "");


# implied volatility
# using proxies for futures
def df = if (GetSymbol() == "/ES") then close("VIX") / 100
else if (GetSymbol() == "/CL") then close("OIV") / 100
else if (GetSymbol() == "/GC") then close("GVX") / 100
else if (GetSymbol() == "/SI") then close("VXSLV") / 100
else if (GetSymbol() == "/NQ") then close("VXN") / 100
else if (GetSymbol() == "/TF") then close("RVX") / 100
else if (GetSymbol() == "/YM") then close("VXD") / 100
else if (GetSymbol() == "/6E") then close("EVZ") / 100
else if (GetSymbol() == "/6J") then close("JYVIX") / 100
else if (GetSymbol() == "/6B") then close("BPVIX") / 100
else if (GetSymbol() == "/ZN") then close("TYVIX") / 100
else if (Getsymbol() == "/ZW") then close("WIV") / 100
else if (Getsymbol() == "/ZB") then imp_volatility("TLT")
else if (Getsymbol() == "/ZC") then imp_volatility("CORN")
else if (Getsymbol() == "/ZS") then imp_volatility("SOYB")
else if (Getsymbol() == "/KC") then imp_volatility("JO")
else if (Getsymbol() == "/NG") then imp_volatility("UNG")
else if (Getsymbol() == "/6S") then imp_volatility("FXF")
else imp_volatility();

def df1 = if !IsNaN(df) then df else df[-1];

# calculate the IV rank
# ---------------------------
# calculate the IV rank
def low_over_timespan = if IsNaN(Lowest(df1, days_back)) then LowestAll(df1) else Lowest(df1, days_back);
def high_over_timespan = if IsNAN(Highest(df1, days_back)) then HighestAll(df1) else Highest(df1, days_back);

def iv_rank = (df1 - low_over_timespan) / (high_over_timespan - low_over_timespan) * 100.0;

plot IVRs = iv_rank;
IVRs.SetLineWeight(3);
IVRs.AssignValueColor(if iv_rank >= ivr_target then Color.GREEN else
if iv_rank <= ivr_lower_limit then Color.RED
else Color.GRAY);

plot Level = ivr_target;
Level.SetDefaultColor(Color.GREEN);
plot Low = ivr_lower_limit;
Low.SetDefaultColor(Color.RED);

AddLabel(yes, "IVR " + Round(iv_rank, 2), if iv_rank >= ivr_target then Color.GREEN
else if iv_rank <= ivr_lower_limit then Color.RED
else Color.GRAY);
 
Code:
## OneNote Archive Name: IV Rank and IV Percentile Plots _TT
## Archive Section: Volatility
## Suggested Tos Name using JQ naming convention: IV_Rank_IV_Percentile_TT
## Archive Date: 10.22.2018
## Archive Notes:
## End OneNote Archive Header.  Script follows.

# tastytrade/dough
# m.r. v1.6
#
# plots both IV Rank and IV Percentile
#
# IV Rank is a description of where the current IV lies in comparison to its yearly high and low IV
# IV Percentile tells the percentage of days over the last year, that were below the current IV
#
# for information on the two, see Skinny on Options Data Science, titled "IV Rank and IV Percentile"
# http://ontt.tv/1Nt4fcS

declare lower;
declare hide_on_intraday;
input days_back = 252; # we usually do this over one year (252 trading days)

# implied volatility
# using proxies for futures
def df = if (GetSymbol() == "/ES") then close("VIX") / 100
else if (GetSymbol() == "/CL") then close("OIV") / 100
else if (GetSymbol() == "/GC") then close("GVX") / 100
else if (GetSymbol() == "/SI") then close("VXSLV") / 100
else if (GetSymbol() == "/NQ") then close("VXN") / 100
else if (GetSymbol() == "/TF") then close("RVX") / 100
else if (GetSymbol() == "/YM") then close("VXD") / 100
else if (GetSymbol() == "/6E") then close("EVZ") / 100
else if (GetSymbol() == “/6J”) then close(“JYVIX”) / 100
else if (GetSymbol() == “/6B”) then close(“BPVIX”) / 100
else if (GetSymbol() == “/ZB”) then close(“TLT”) / 100
else if (GetSymbol() == "/ZN") then close(“TYVIX”) / 100
else imp_volatility();


def df1 = if !IsNaN(df) then df else df[-1];

# display regular implied volatility
# ---------------------------
AddLabel(yes, "IV: " + Round(df1 * 100.0, 0), Color.ORANGE);

# calculate the IV rank
# ---------------------------
# calculate the IV rank
def low_over_timespan = Lowest(df1, days_back);
def high_over_timespan = Highest(df1, days_back);

def iv_rank = Round( (df1 - low_over_timespan) / (high_over_timespan - low_over_timespan) * 100.0, 0);
plot IVRank = iv_rank;
IVRank.SetDefaultColor(Color.GRAY);
AddLabel(yes, "IV Rank: " + iv_rank + " (i.e. our default metric for analyzing IV)", Color.GREEN);

# calculate the IV percentile
# ---------------------------
# how many times over the past year, has IV been below the current IV
def counts_below = fold i = 1 to days_back + 1 with count = 0
do
  if df1[0] > df1[i] then
    count + 1
  else
    count;

def iv_percentile = Round(counts_below / days_back * 100.0, 0);
plot IVPercentile = iv_percentile;
IVPercentile.SetDefaultColor(Color.GREEN);
AddLabel(yes, "IV Percentile: " + iv_percentile + " (i.e. " + iv_percentile + "% of days or " + counts_below + " days out of " + days_back + " days were below the current IV)", Color.GREEN);

AddCloud(iv_rank, iv_percentile, Color.PINK, Color.YELLOW);

#my edits for IVR 30 and 50 levels of when to put on Strangles
#Also added color and line weight settings
plot minRank =30;
minRank.SetLineWeight(2);
minRank.SetDefaultColor(color = Color.Red);
Plot midRank =50;
midRank.SetLineWeight(2);
midRank.SetDefaultColor(color = Color.LIGHT_GREEN);

#label to alert when IVR greater than 30 and 50

def minRankLevel = if iv_rank >minRank then Yes else No;

AddLabel(yes, "Sell Strangle: Green=Sell:  "  + minRankLevel + "",if iv_rank > minRank then Color.GREEN else if iv_rank < minRank then color.Light_Gray else color.LIGHT_GRAY);
I put this script on my TOS but I don't see any graph...
 
@aida The script works for me. This is not an intraday indicator. Is it possible you are using it on a timeframe less than daily?
Screenshot (27).png
 
Last edited:
As new member to this forum. Thought I share this IV rank indicator for ThinkorSwim that helps me increase probability of success. This script was taken from tastytrade. The rule is to sell premiums that are at least above 50% IV rank. You can watch this video to find out more https://uat.tastytrade.com/tt/shows...nk-and-iv-percentile-w-thinkscript-11-12-2015

AnhUeXm.png


Code:
# ------------------------START BELOW THIS LINE--------------------------

#

# tastytrade/dough Research Team

# Michael Rechenthin, Ph.D.

# Follow me on twitter:  @mrechenthin

#

# IV Rank is a description of where the current IV lies in comparison

# to its yearly high and low IV

#

# IV Percentile gives the percentage of days over the last year, that

# were below the current IV.  If the IV Rank is above 50%, then

# the script will highlight it green; otherwise red.

#

# For information on the two, see Skinny on Options Data Science,

# titled "IV Rank and IV Percentile (w/ thinkscript)" on Nov 12, 2015

# http://ontt.tv/1Nt4fcS

#

# version 3.2

#

declare lower;

declare hide_on_intraday; # do not display when using intra-day plots

input days_back = 252; # it is most common to use 1-year (or 252 trading days)


def x;

if GetAggregationPeriod() > AggregationPeriod.DAY {

x=1;

} else {

x=2;

}

AddLabel(yes, if (x==1) then "This script should be used on daily charts only" else "");


# implied volatility

# using proxies for futures

def df = if (GetSymbol() == "/ES") then close("VIX") / 100

else if (GetSymbol() == "/CL") then close("OIV") / 100

else if (GetSymbol() == "/GC") then close("GVX") / 100

else if (GetSymbol() == "/SI") then close("VXSLV") / 100

else if (GetSymbol() == "/NQ") then close("VXN") / 100

else if (GetSymbol() == "/TF") then close("RVX") / 100

else if (GetSymbol() == "/YM") then close("VXD") / 100

else if (GetSymbol() == "/6E") then close("EVZ") / 100

else if (GetSymbol() == "/6J") then close("JYVIX") / 100

else if (GetSymbol() == "/6B") then close("BPVIX") / 100

else if (GetSymbol() == "/ZN") then close("TYVIX") / 100

else if (Getsymbol() == "/ZW") then close("WIV") / 100

else if (Getsymbol() == "/ZB") then imp_volatility("TLT")

else if (Getsymbol() == "/ZC") then imp_volatility("CORN")

else if (Getsymbol() == "/ZS") then imp_volatility("SOYB")

else if (Getsymbol() == "/KC") then imp_volatility("JO")

else if (Getsymbol() == "/NG") then imp_volatility("UNG")

else if (Getsymbol() == "/6S") then imp_volatility("FXF")

else imp_volatility();


def df1 = if !IsNaN(df) then df else df[-1];


# display regular implied volatility

# ---------------------------

AddLabel(yes, "IV: " + Round(df1 * 100.0, 0), Color.ORANGE);


# calculate the IV rank

# ---------------------------

# calculate the IV rank

def low_over_timespan = Lowest(df1, days_back);

def high_over_timespan = Highest(df1, days_back);


def iv_rank = Round( (df1 - low_over_timespan) / (high_over_timespan - low_over_timespan) * 100.0, 0);


AddLabel(yes, "IV Rank: " + iv_rank + "%", if iv_rank > 50 then Color.GREEN else Color.RED);


# calculate the IV percentile

# ---------------------------

# how many times over the past year, has IV been below the current IV

def counts_below = fold i = 1 to days_back + 1 with count = 0

do

  if df1[0] > df1 then

    count + 1

  else

    count;


def iv_percentile = Round(counts_below / days_back * 100.0, 0);

plot IVs = df1 * 100;

IVs.SetLineWeight(3);

IVs.AssignValueColor(if iv_rank > 50 then Color.GREEN else Color.RED);


AddLabel(yes, "IV Percentile: " + iv_percentile + "% of days were below the past year's IV", if iv_percentile > 50 then Color.GREEN else Color.RED);


# thanks to Kevin Osborn for the following line

AddLabel(yes, if (GetSymbol() == "/6S" or GetSymbol() == "/ZB" or GetSymbol() == "/ZC" or GetSymbol() == "/NG" or GetSymbol() == "/ZS" or GetSymbol() == "/KC") then "* ETF based" else "", Color.BLACK);


# ------------------------END ABOVE THIS LINE--------------------------

How to Scan for IV Rank in ThinkorSwim

This is an IV (Implied Volatility) rank scanner that you can use.

Code:
def IV = if isNaN(imp_Volatility())
         then IV[1]
         else imp_Volatility();
def IVrank = (fold i = 0 to 252
              with p
              do p + if IV > getValue(IV, i)
                     then 1
                     else 0) / 252;
plot cond = IVrank > .9;

Notes from Mobius:
Is there a way to make this code work intraday? Great indicator! Thanks!
 

Join useThinkScript to post your question to a community of 21,000+ developers and traders.

Similar threads

Not the exact question you're looking for?

Start a new thread and receive assistance from our community.

87k+ Posts
430 Online
Create Post

Similar threads

Similar threads

The Market Trading Game Changer

Join 2,500+ subscribers inside the useThinkScript VIP Membership Club
  • Exclusive indicators
  • Proven strategies & setups
  • Private Discord community
  • ‘Buy The Dip’ signal alerts
  • Exclusive members-only content
  • Add-ons and resources
  • 1 full year of unlimited support

Frequently Asked Questions

What is useThinkScript?

useThinkScript is the #1 community of stock market investors using indicators and other tools to power their trading strategies. Traders of all skill levels use our forums to learn about scripting and indicators, help each other, and discover new ways to gain an edge in the markets.

How do I get started?

We get it. Our forum can be intimidating, if not overwhelming. With thousands of topics, tens of thousands of posts, our community has created an incredibly deep knowledge base for stock traders. No one can ever exhaust every resource provided on our site.

If you are new, or just looking for guidance, here are some helpful links to get you started.

What are the benefits of VIP Membership?
VIP members get exclusive access to these proven and tested premium indicators: Buy the Dip, Advanced Market Moves 2.0, Take Profit, and Volatility Trading Range. In addition, VIP members get access to over 50 VIP-only custom indicators, add-ons, and strategies, private VIP-only forums, private Discord channel to discuss trades and strategies in real-time, customer support, trade alerts, and much more. Learn all about VIP membership here.
How can I access the premium indicators?
To access the premium indicators, which are plug and play ready, sign up for VIP membership here.
Back
Top