Thank you for sharing this. Since ToS shareable links are still not working, I went ahead and posted the source code for both the upper and lower study directly into the post. I hope you don't mind
A poster requested a scan of turning points. Ma_min is a turning point. Read through the thread for more information. Pay attention to the discussion as to the lag.
You can change the scan to trigger on buy signal and review charts to determine which fits your strategy better
HTH
Thank you all for your comments and encouragement.
I have a laundry list of things in this post:
Variations to scripts
Scanner
Testing
Script Variations
@chillc15, I'm intrigued by the Arnaud Legoux MA, and so here is a variant of the upper study that will allow you to choose between Hull, Simple, Exponential, Williams, and ALMA. I haven't gone through the various permutations, but bear in mind that the 'overshoot' and smoothing of the Hull is part of what makes the turning point signal so attractive.
@Miket Used your posted code for the ALMA. Hope you're good with this use. Thanks!
Code:
#
# Multiple Moving Average Concavity and Turning Points
#  or
# The Second Derivative of the A Moving Average
#
# via useThinkScript
# request from chillc15
# Added Arnaud Legoux MA and other Moving Averages
#
# Author: Seth Urion (Mahsume)
# Version: 2020-02-22 V2
#
# This code is licensed (as applicable) under the GPL v3
#
# ----------------------

declare upper;

input price = HL2;
input MA_Length = 21;
input lookback = 2;

input MovingAverage = {default "HMA", "EMA", "SMA", "WMA", "ALMA"};

script ALMA {
# Attributed to Miket
# https://tos.mx/9mznij
# https://usethinkscript.com/threads/alma-arnaud-legoux-ma-indicator-for-thinkorswim.174/
input Data = close;
input Window = 9;
input Sigma = 6;
input Offset = 0.85;

def m = (Offset * (Window - 1));
def s = Window/Sigma;

def SumVectorData = fold y = 0 to Window with WS do WS + Exp(-(sqr(y-m))/(2*sqr(s))) * getvalue(Data, (Window-1)-y);
def SumVector = fold z = 0 to Window with CW do CW + Exp(-(sqr(z-m))/(2*sqr(s)));

plot ALMA = SumVectorData / SumVector;
}

plot MA;
switch (MovingAverage) {
case EMA:
    MA = MovAvgExponential(price, length = MA_Length);
case SMA:
    MA = simpleMovingAvg(price, length = MA_Length);
case WMA:
    MA = wma(price, length = MA_Length);
case ALMA:
    MA = ALMA(Data = price, window = MA_Length);
default:
    MA = HullMovingAvg(price = price, length = MA_Length);
}


def delta = MA[1] - MA[lookback + 1];
def delta_per_bar = delta / lookback;

def next_bar = MA[1] + delta_per_bar;

def concavity = if MA > next_bar then 1 else -1;

plot turning_point = if concavity[-1] != concavity then MA else double.nan;

MA.AssignValueColor(color = if concavity == -1 then
    if MA > MA[1] then color.dark_orange else color.red else
    if MA < MA[1] then color.dark_green else color.green);

MA.SetLineWeight(3);

turning_point.SetLineWeight(4);
turning_point.SetPaintingStrategy(paintingStrategy = PaintingStrategy.POINTS);
turning_point.SetDefaultColor(color.white);

plot MA_Max = if MA[-1] < MA and MA > MA[1] then MA else Double.NaN;
MA_Max.SetDefaultColor(Color.WHITE);
MA_Max.SetPaintingStrategy(PaintingStrategy.SQUARES);
MA_Max.SetLineWeight(3);

plot MA_Min = if MA[-1] > MA and MA < MA[1] then MA else Double.Nan;
MA_Min.SetDefaultColor(Color.WHITE);
MA_Min.SetPaintingStrategy(PaintingStrategy.TRIANGLES);
MA_Min.SetLineWeight(3);

plot sell = if turning_point and concavity == 1 then high else double.nan;
sell.SetDefaultColor(Color.DARK_ORANGE);
sell.SetPaintingStrategy(PaintingStrategy.ARROW_DOWN);
sell.SetLineWeight(3);

plot buy = if turning_point and concavity == -1 then low else double.nan;
buy.SetDefaultColor(Color.CYAN);
buy.SetPaintingStrategy(PaintingStrategy.ARROW_UP);
buy.SetLineWeight(3);

def divergence = MA - next_bar;

addLabel(yes, concat("DIVERGENCE: " , divergence), color = if concavity < 0 then if divergence[1] > divergence then Color.RED else color.PINK else if divergence[1] < divergence then color.green else color.yellow);
This scan relies on the upper study being called "Concavity" and is entered on the scan page as a custom.
Code:
Concavity("hma length" = 55, price = CLOSE)."buy" is true within 2 bars
Scan 2 -- Stocks approaching possible Buy signals
I thought that, since the lower indicator crossovers can generate signals, that an 'early warning' scan might be of interest. We can scan for any HMA that has a negative convergence, and look for a decrease in the distance below zero. It may be a long way off, it may never get there, but we are alerted before the trade entry.
Code:
script ConcavityDivergence {
#
# Hull Moving Average Concavity Divergence
#  or
# The Second Derivative of the Hull Moving Average
#
# Author: Seth Urion (Mahsume)
# Version: 2020-02-21 Initial Public
#
# This code is licensed (as applicable) under the GPL v3
#
# ----------------------

declare lower;

input price = HL2;

input HMA_length = 34;
input lookback = 2;

def HMA = HullMovingAvg(length = HMA_length, price = price);

def delta = HMA[1] - HMA[lookback + 1];
def delta_per_bar = delta / lookback;

def next_bar = HMA[1] + delta_per_bar;

def concavity = if HMA > next_bar then 1 else -1;

plot zero = 0;
zero.setdefaultcolor(color.gray);
zero.setpaintingstrategy(PaintingStrategy.DASHES);

plot divergence = displacer(-1, HMA - next_bar);
divergence.setDefaultColor(Color.LIME);
divergence.SetLineweight(2);

plot cx_up = if divergence crosses above zero then 0 else double.nan;
cx_up.SetPaintingStrategy(PaintingStrategy.POINTS);
cx_up.SetDefaultColor(Color.LIGHT_GREEN);
cx_up.SetLineWeight(4);

plot cx_down = if divergence crosses below zero then 0 else double.nan;
cx_down.SetPaintingStrategy(PaintingStrategy.POINTS);
cx_down.SetDefaultColor(Color.RED);
cx_down.SetLineWeight(4);

}

def signal = ConcavityDivergence("hma length" = 55)."concavity";
def HMA = ConcavityDivergence("hma length" = 55)."HMA";
def next = ConcavityDivergence("hma length" = 55)."next_bar";

plot buy = signal < 0 and (HMA - next) > (HMA[1] - next[1]);
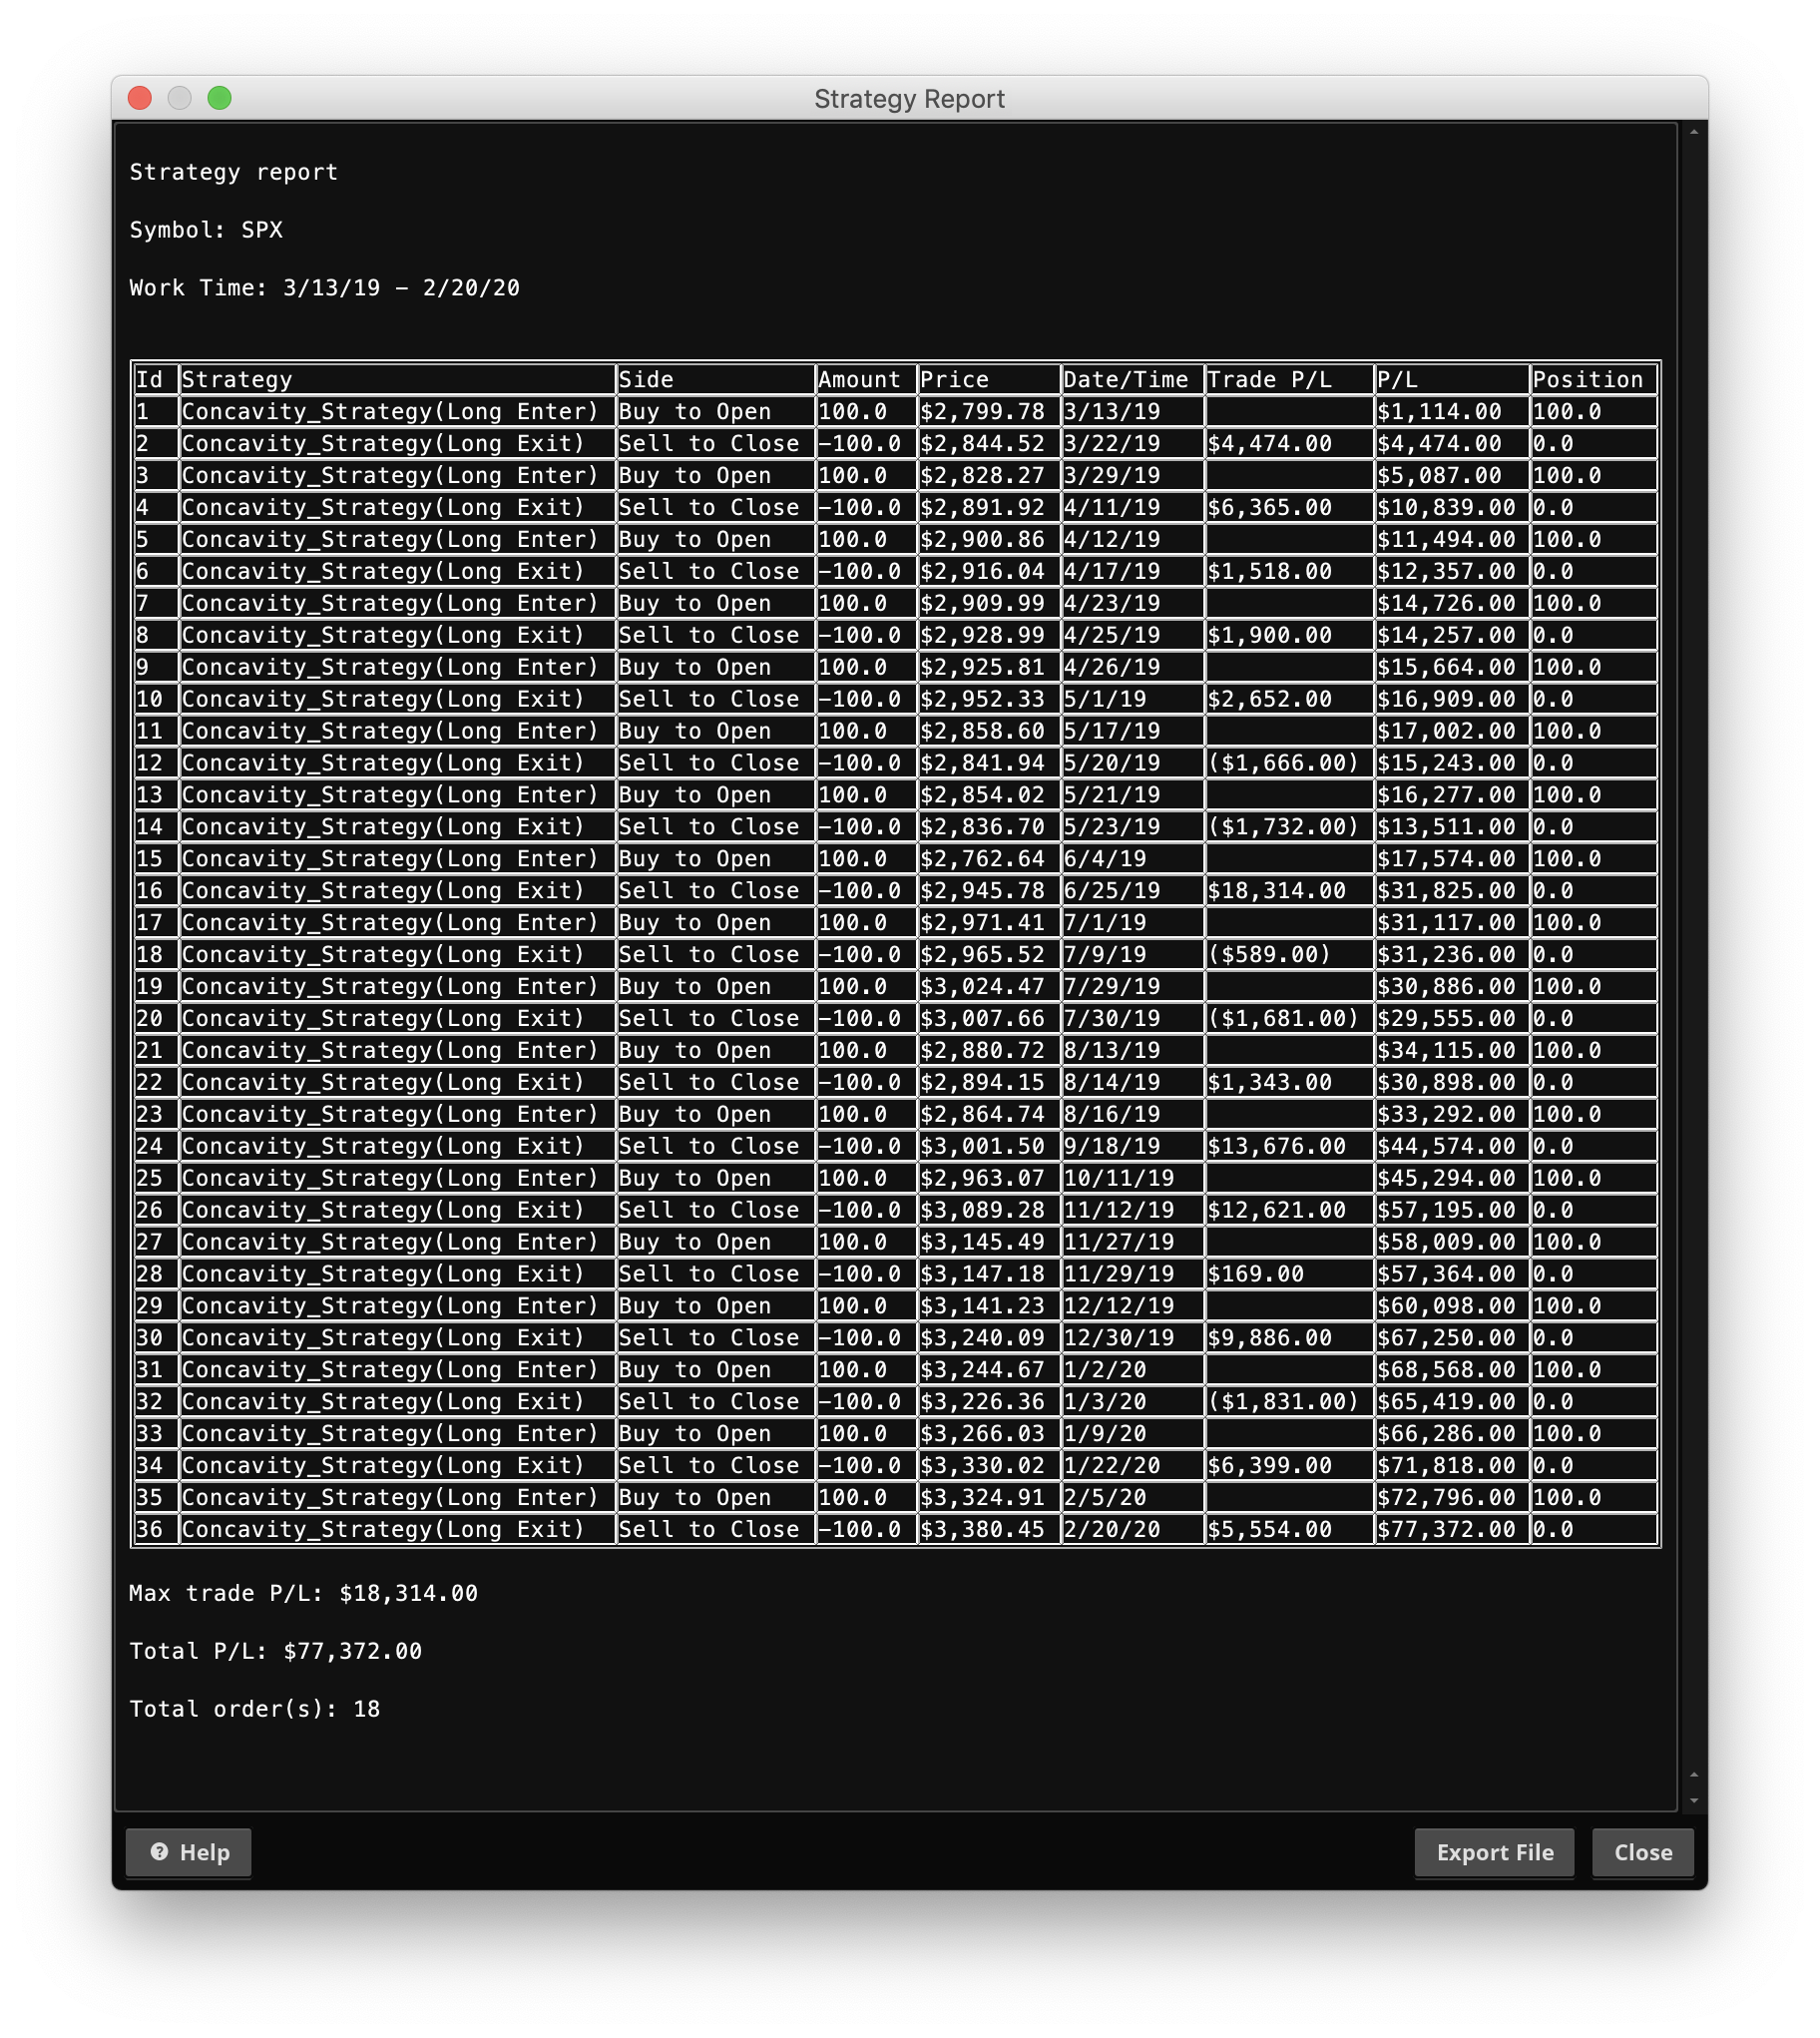
TESTING
I used the built-in strategy feature of thinkorswim, with block sizes of 100. All tests were run on 1 year Daily charts, with an HMA length of 55 and set price to CLOSE
First SPX
Buy and Hold: $55,600
Strategy: $77,372
Delta + $21772
Next ADI
Buy and Hold: $1718
Strategy: $5202
Delta: + $3483
Last BA
Buy and Hold: ($9322)
Strategy: $14393
Delta: + $23715
SHORT TIME FRAMES
I did not take time today to test shorter timeframes, though I imagine the results would be good. If there is interest, I'll try to post up some another time.
If you've read this far, thank you.
Happy trading and good luck.
Part One --
Load Shared Link: http://tos.mx/11zv4QASave the study under the name: Mashume_Hull_Lower. (if you skip this part the scanner in part two will not work)
Click here for --> Easiest way to load shared links
It goes without saying, but I will say it anyway ... No trade should ever be entered into based on one indicator or one time frame
Read more: Basic Tenets Of A Good Strategy
There are a bunch of scans scattered around, but I don't have off the top of my head. Sorry. You can find some good threads about how to use studies in scans here abouts somewhere too.
There are a bunch of scans scattered around, but I don't have off the top of my head. Sorry. You can find some good threads about how to use studies in scans here abouts somewhere too.
Thanks for your prompt reply. My question was specifically about concavity. None of the scans I have come across specifically picks out the buy/sell signals.
@BenTen is there any easier way for when setting up a new Usethinkscript thread that all posts can be more ORGANIZED and in CHRONOLOGICAL ORDER so as to not confuse people that are not experts and have all posts that have SCRIPTS and LINKS with MULTIPLE VERSIONS again MORE ORGANIZED AND IN ORDER so as to research, learn and experience this sites content a hell of a lot easier??
@JPIMP The indicator in the 1st post is the most updated script of the basic indicator. Posters unselfishly add and modify many flavors of their take on indicators and then there are subsequent conversations as to the caveats to using those flavors. This flow is important so the different flavors need to be embedded where they are. The posts that follow are important to understanding how to use them.
Whether using indicators from this forum or found elsewhere, it is important to read everything you can about the indicator. If after reading the threads, you are still confused. You can plug and play the different versions. There is no better way to learn more about how and what an indicator does than by using it.
Need some help with Hull Watchlist column, New to coding, I have put together a codes from mashuame's Hull MA. I want Ma_Max, Ma_min or Turning point and concavity to show on watchlist column. I'm getting yellow color only on watchlist. Thank you in Advance.
AssignBackgroundColor(if buy then color.YELLOW else if sell then color.LIGHT_RED else color.WHITE);
AddLabel(yes, if Bulltrigger then "" else if BearTrigger then "" else " - ", if BearTrigger then Color.dark_red else if Bulltrigger then Color.dark_GREEN else Color.ORANGE);
AssignBackgroundColor(color.light_ORANGE);
useThinkScript is the #1 community of stock market investors using indicators and other tools to power their trading strategies. Traders of all skill levels use our forums to learn about scripting and indicators, help each other, and discover new ways to gain an edge in the markets.
How do I get started?
We get it. Our forum can be intimidating, if not overwhelming. With thousands of topics, tens of thousands of posts, our community has created an incredibly deep knowledge base for stock traders. No one can ever exhaust every resource provided on our site.
If you are new, or just looking for guidance, here are some helpful links to get you started.
VIP members get exclusive access to these proven and tested premium indicators: Buy the Dip, Advanced Market Moves 2.0, Take Profit, and Volatility Trading Range. In addition, VIP members get access to over 50 VIP-only custom indicators, add-ons, and strategies, private VIP-only forums, private Discord channel to discuss trades and strategies in real-time, customer support, trade alerts, and much more. Learn all about VIP membership here.
How can I access the premium indicators?
To access the premium indicators, which are plug and play ready, sign up for VIP membership here.

") ..
..
 " else if BearTrigger then "
 " else " - ", if BearTrigger then Color.dark_red else if Bulltrigger then Color.dark_GREEN else Color.ORANGE);