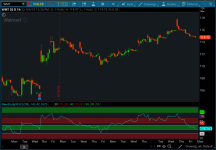
Hima Reddy RSI Power Zones Indicator for ThinkorSwim

BenTen

Administrative
Staff member
Staff
VIP
Lifetime
This is a repost from the Yahoo's thinkScript group.

Has anyone here got a thinkscript that places the Hima Reddy Bear Support (20 to 30) and Bear Resistance (55 to 65) Zones and Bull Support (40 to 50) and Bull Resistance (80 to 90) Power Zones on the RSI Indicator? I would appreciate receiving the code if you do...

Oq2QEbr.png


thinkScript Code

Code:
#-----------------------------#
# ---- By Syracusepro ----#

declare lower;

#A: With RSI on a 14 period setting (this is crucial!)
#Bull Resistance Power Zone = 80 to 90
#Bear Resistance Power Zone = 55 to 65
#Bull Support Power Zone = 40 to 50
#Bear Support Power Zone = 20 to 30

def hm_RSI = RSI();

plot himma = hm_rsi;

plot bullRes = 90;
bullRes.setDefaultColor(color.green);

plot bullResb = 80;
bullResb.setDefaultColor(color.green);

plot bearRes = 70;
bearRes.setDefaultColor(color.red);

plot bearResb = 60;
bearResb.setDefaultColor(color.red);

plot bullSupp = 50;
bullSupp.setDefaultColor(color.green);

plot bullSuppb = 40;
bullSuppb.setDefaultColor(color.green);

plot bearSupp = 30;
bearSupp.setDefaultColor(color.red);

plot bearSuppb = 20;
bearSuppb.setDefaultColor(color.red);

#------------------------------#

Fancy Version

Code:
#-----------#

declare lower;

#--------------- Relative Strength Index" -------------#
#----- Translated from pinescript to thinkscript ------#
#----------------- by Syracusepro ---------------------#

input src = close;
input len = 14; #"Length"

plot rsi = rsi(len, close);

plot band1 = 70;
plot band0 = 30;

#addCloud(band1, band0, color.magenta);

plot h1 = 20;
h1.setDefaultColor(color.red);

plot h2 = 30;
h2.setDefaultColor(color.red);

plot h3 = 40;
h3.setdefaultColor(color.green);

plot h5 = 55;
h5.setDefaultColor(color.red);

plot h6 = 65;
h6.setDefaultColor(color.red);

plot h7 = 80;
h7.setdefaultColor(color.green);

plot h8 = 90;
h8.setdefaultColor(color.green);

plot h9 = 50;
h9.setdefaultColor(color.green);

addCloud(h1,h2, color.red, color.red);
addCloud(h3,h9, color.green, color.green);
addCloud(h5,h6, color.red, color.red);
addCloud(h7,h8, color.green, color.green);
#-----------#

Video


Attachments

  • Oq2QEbr.png
    Oq2QEbr.png
    95.9 KB · Views: 212

Join useThinkScript to post your question to a community of 21,000+ developers and traders.

This is a more complicated indicator than I bet most people want to learn. One of the uses I liked was drawing trend lines that the rsi bounces off within certain zones. Study it and you will find out where.
 
In a 'bullish market' Bulls believe that RSI has a Support of 40-50 and a Resistance of 80-90 while in a 'bearish market' the bears believe that RSI has a Support of 20-30 and a Resistance of 55-60... Cool
 
Stocks. It is an RSI With levels of support that you are supposed to connect three lines before taking the trade. Thanks for checking.
 
@Marvinpatt The indicator plots eight lines.
If you are looking to scan for RSI. you can use the TOS RSI indicator and scan for RSI crosses above (or crosses below) any of the below numbers.
plot bullRes = 90;
bullRes.setDefaultColor(color.green);

plot bullResb = 80;
bullResb.setDefaultColor(color.green);

plot bearRes = 70;
bearRes.setDefaultColor(color.red);

plot bearResb = 60;
bearResb.setDefaultColor(color.red);

plot bullSupp = 50;
bullSupp.setDefaultColor(color.green);

plot bullSuppb = 40;
bullSuppb.setDefaultColor(color.green);

plot bearSupp = 30;
bearSupp.setDefaultColor(color.red);

plot bearSuppb = 20;
bearSuppb.setDefaultColor(color.red);
 
Last edited:
I modified the code for better detection of overbought and oversold states.
Ruby:
#-----------#

declare lower;

#--------------- Relative Strength Index" -------------#
#----- Translated from pinescript to thinkscript ------#
#----------------- by Syracusepro ---------------------#

input src = close;
input len = 14; #"Length"

plot rsi = rsi(len, close);

plot band1 = 70;
plot band0 = 30;

#addCloud(band1, band0, color.magenta);

plot h1 = 20;
h1.setDefaultColor(color.red);

plot h2 = 30;
h2.setDefaultColor(color.red);

plot h3 = 40;
h3.setdefaultColor(color.green);

plot h5 = 60;
h5.setDefaultColor(color.red);

plot h6 = 70;
h6.setDefaultColor(color.red);

plot h7 = 80;
h7.setdefaultColor(color.green);

plot h8 = 90;
h8.setdefaultColor(color.green);

plot h9 = 50;
h9.setdefaultColor(color.green);

plot h10 = 10;
h10.setdefaultColor(color.green);

plot h11 = 0;
h11.setdefaultColor(color.green);

plot h12 = 100;
h12.setdefaultColor(color.red);

addCloud(h1,h2, color.red, color.red);
addCloud(h3,h9, color.green, color.green);
addCloud(h5,h6, color.red, color.red);
addCloud(h7,h8, color.green, color.green);
addCloud(h10,h11, color.green, color.green);

input over_bought = 80;
input over_sold = 20;
input KPeriod = 10;
input DPeriod = 10;
input priceH = high;
input priceL = low;
input priceC = close;
input averageType = AverageType.SIMPLE;
input showBreakoutSignals = {default "No", "On SlowK", "On SlowD", "On SlowK & SlowD"};

plot SlowK = reference StochasticFull(over_bought,over_sold,KPeriod,DPeriod,priceH,priceL,priceC,3,averageType).FullK;
plot SlowD = reference StochasticFull(over_bought,over_sold,KPeriod,DPeriod,priceH,priceL,priceC,3,averageType).FullD;
plot OverBought = over_bought;
plot OverSold = over_sold;

def upK = SlowK crosses above OverSold;
def upD = SlowD crosses above OverSold;
def downK = SlowK crosses below OverBought;
def downD = SlowD crosses below OverBought;

plot UpSignal;
plot DownSignal;
switch (showBreakoutSignals) {
case "No":
UpSignal = Double.NaN;
DownSignal = Double.NaN;
case "On SlowK":
UpSignal = if upK then OverSold else Double.NaN;
DownSignal = if downK then OverBought else Double.NaN;
case "On SlowD":
UpSignal = if upD then OverSold else Double.NaN;
DownSignal = if downD then OverBought else Double.NaN;
case "On SlowK & SlowD":
UpSignal = if upK or upD then OverSold else Double.NaN;
DownSignal = if downK or downD then OverBought else Double.NaN;
}

UpSignal.setHiding(showBreakoutSignals == showBreakoutSignals."No");
DownSignal.setHiding(showBreakoutSignals == showBreakoutSignals."No");

SlowK.setDefaultColor(GetColor(5));
SlowD.setDefaultColor(GetColor(0));
OverBought.SetDefaultColor(GetColor(1));
OverSold.SetDefaultColor(GetColor(1));
UpSignal.SetDefaultColor(Color.UPTICK);
UpSignal.SetPaintingStrategy(PaintingStrategy.ARROW_UP);
DownSignal.SetDefaultColor(Color.DOWNTICK);
DownSignal.SetPaintingStrategy(PaintingStrategy.ARROW_DOWN);
 

Similar threads

Not the exact question you're looking for?

Start a new thread and receive assistance from our community.

87k+ Posts
307 Online
Create Post

Similar threads

Similar threads

The Market Trading Game Changer

Join 2,500+ subscribers inside the useThinkScript VIP Membership Club
  • Exclusive indicators
  • Proven strategies & setups
  • Private Discord community
  • ‘Buy The Dip’ signal alerts
  • Exclusive members-only content
  • Add-ons and resources
  • 1 full year of unlimited support

Frequently Asked Questions

What is useThinkScript?

useThinkScript is the #1 community of stock market investors using indicators and other tools to power their trading strategies. Traders of all skill levels use our forums to learn about scripting and indicators, help each other, and discover new ways to gain an edge in the markets.

How do I get started?

We get it. Our forum can be intimidating, if not overwhelming. With thousands of topics, tens of thousands of posts, our community has created an incredibly deep knowledge base for stock traders. No one can ever exhaust every resource provided on our site.

If you are new, or just looking for guidance, here are some helpful links to get you started.

What are the benefits of VIP Membership?
VIP members get exclusive access to these proven and tested premium indicators: Buy the Dip, Advanced Market Moves 2.0, Take Profit, and Volatility Trading Range. In addition, VIP members get access to over 50 VIP-only custom indicators, add-ons, and strategies, private VIP-only forums, private Discord channel to discuss trades and strategies in real-time, customer support, trade alerts, and much more. Learn all about VIP membership here.
How can I access the premium indicators?
To access the premium indicators, which are plug and play ready, sign up for VIP membership here.
Back
Top