
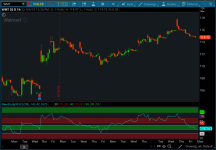
What the trader sees
The script paints fixed RSI zones so you always know which side controls momentum. When RSI pushes into the bull resistance zone (80–90), you’re looking at strength that refuses to fade; pullbacks usually get bought. When RSI holds the bull support zone (40–50), buyers defend every dip and the trend stays intact. When RSI stalls in the bear resistance zone (55–65), rallies fail and sellers lean on strength. When RSI sinks into the bear support zone (20–30), weakness persists and bounces fade fast.
The indicator doesn’t predict. It classifies. It tells you which side has control and whether a move is continuation or exhaustion.
What the trader does
If RSI lives in bull zones, you trade from the long side and ignore short setups unless RSI collapses through bull support. If RSI lives in bear zones, you trade from the short side and ignore long setups unless RSI reclaims bear resistance. If RSI flips zones, you treat it as a regime change and adjust bias immediately. The zones tell you when to press, when to wait, and when to stop fighting the tape.
| Zone | Meaning | Trader Action |
|---|---|---|
| Bull Resistance 80–90 | Momentum at full extension; buyers in control | Favor longs; buy dips; avoid shorts |
| Bull Support 40–50 | Pullbacks defended; trend intact | Stay long‑biased; treat dips as continuation |
| Bear Resistance 55–65 | Rallies fail; sellers lean on strength | Favor shorts; fade pops; avoid longs |
| Bear Support 20–30 | Weakness persists; bounces fade | Stay short‑biased; treat bounces as continuation |
thinkScript Code
Code:
#-----------------------------#
# Hima Reddy RSI Power Zones Indicator
# ---- By Syracusepro ----#

declare lower;

#A: With RSI on a 14 period setting (this is crucial!)
#Bull Resistance Power Zone = 80 to 90
#Bear Resistance Power Zone = 55 to 65
#Bull Support Power Zone = 40 to 50
#Bear Support Power Zone = 20 to 30

def hm_RSI = RSI();

plot himma = hm_rsi;

plot bullRes = 90;
bullRes.setDefaultColor(color.green);

plot bullResb = 80;
bullResb.setDefaultColor(color.green);

plot bearRes = 70;
bearRes.setDefaultColor(color.red);

plot bearResb = 60;
bearResb.setDefaultColor(color.red);

plot bullSupp = 50;
bullSupp.setDefaultColor(color.green);

plot bullSuppb = 40;
bullSuppb.setDefaultColor(color.green);

plot bearSupp = 30;
bearSupp.setDefaultColor(color.red);

plot bearSuppb = 20;
bearSuppb.setDefaultColor(color.red);

#------------------------------#
Fancy Version
Code:
#-----------#

declare lower;

#--------------- Relative Strength Index" -------------#
#----- Translated from pinescript to thinkscript ------#
#----------------- by Syracusepro ---------------------#

input src = close;
input len = 14; #"Length"

plot rsi = rsi(len, close);

plot band1 = 70;
plot band0 = 30;

#addCloud(band1, band0, color.magenta);

plot h1 = 20;
h1.setDefaultColor(color.red);

plot h2 = 30;
h2.setDefaultColor(color.red);

plot h3 = 40;
h3.setdefaultColor(color.green);

plot h5 = 55;
h5.setDefaultColor(color.red);

plot h6 = 65;
h6.setDefaultColor(color.red);

plot h7 = 80;
h7.setdefaultColor(color.green);

plot h8 = 90;
h8.setdefaultColor(color.green);

plot h9 = 50;
h9.setdefaultColor(color.green);

addCloud(h1,h2, color.red, color.red);
addCloud(h3,h9, color.green, color.green);
addCloud(h5,h6, color.red, color.red);
addCloud(h7,h8, color.green, color.green);
#-----------#
Video
Attachments
Last edited by a moderator: