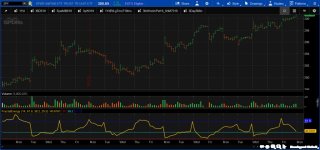
Name this Study "FractalEnergy" in ToS

https://tos.mx/b5pYH5
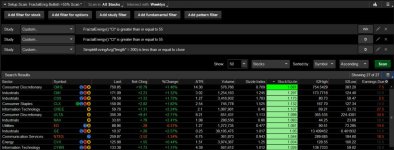
SCAN SETUP:

NOTES:
Mobius, AlphaInvestor, & Harndog discuss Fractal Linear Energy June 6, 2016 TSL - edited by Markos
SYNOPSIS
This indicator does NOT indicate OB or OS but linear or non-linear the closer to 1 the more non-linear (compressed or random) price is. The closer to 0 the more linear (trending) price is.
Fractal Energy isn't an indicator - it's a way of looking at price to see if it's linear or random. There are NO trading signals on the FE study. Only signals NOT to trade. Trend or non-trend. It has nothing that determines which way trend is going, as in up or down.
If the FE is at extremes, something is about to change. It's leading you to a conclusion. If the FE is below .382, price is parabolic and cannot maintain that. But you may not want to sell because it may still go further in it's trend and it may not change direction right away. It's telling you though that it's not going to stay trending at the current rate of speed. If it's over .618 it telling you price is compressing and going sideways rebuilding energy getting ready for another run one way or the other.
Using price in fractals and different times, or ORB with FE and Supertrend or some way to measure when price expansion is contracting or expanding is all you need. Any more than that and you'll be paralyzed by information overload.
No matter what the trader's preferred trading style is, a very informative way to look at anything is using a fractal method. For intraday trading, 2min, 5min, 15min and even one hour charts all with a Fractal energy reading and fractal pivots allows you to easily see the trading patterns and reversal or polarity changes. In other words When higher highs and higher lows are compressing to random sideways action with possible trend changes or just short term aggregations building energy to press on in the trend direction.
In response to the query whether the Fractal Energy is the same concept as the Choppiness Index, if you graph the Choppiness index and the Fractal Linear Efficiency ... they are calculated differently but the shapes are nearly identical for most of their length.
https://tos.mx/b5pYH5
Code:
# Attributed to Doc Severson & Mobius at Theotrade 2017.
# The Choppiness Index was created by Australian commodity trader E.W. Dreiss.#
# Name this Study "FractalEnergy" in ToS

declare lower;

input Period = 14;

input l2 = 61.8;
input l1 = 38.2;
input l0 = 25.0;

def sumTR = Sum (TrueRange(high, close, low), Period);
def HMax =  Highest (high, Period);
def LMax =  Lowest (low, Period);

plot FE = 100 * Log (sumTR / (HMax - LMax)) / Log(Period);
FE.SetDefaultColor(Color.ORANGE);
FE.SetStyle (Curve.FIRM);
FE.SetLineWeight(2);

plot line0 = l0;
line0.SetDefaultColor(Color.RED);
#line0.SetStyle (Curve.FIRM);
plot line1 = l1;
line1.SetDefaultColor(Color.CYAN);
#line1.SetStyle (Curve.FIRM);
plot line2 = l2;
line2.SetDefaultColor(Color.BLUE);
#line2.SetStyle (Curve.FIRM);
#EndofCode#
SCAN SETUP:
NOTES:
Mobius, AlphaInvestor, & Harndog discuss Fractal Linear Energy June 6, 2016 TSL - edited by Markos
SYNOPSIS
This indicator does NOT indicate OB or OS but linear or non-linear the closer to 1 the more non-linear (compressed or random) price is. The closer to 0 the more linear (trending) price is.
Fractal Energy isn't an indicator - it's a way of looking at price to see if it's linear or random. There are NO trading signals on the FE study. Only signals NOT to trade. Trend or non-trend. It has nothing that determines which way trend is going, as in up or down.
If the FE is at extremes, something is about to change. It's leading you to a conclusion. If the FE is below .382, price is parabolic and cannot maintain that. But you may not want to sell because it may still go further in it's trend and it may not change direction right away. It's telling you though that it's not going to stay trending at the current rate of speed. If it's over .618 it telling you price is compressing and going sideways rebuilding energy getting ready for another run one way or the other.
Using price in fractals and different times, or ORB with FE and Supertrend or some way to measure when price expansion is contracting or expanding is all you need. Any more than that and you'll be paralyzed by information overload.
No matter what the trader's preferred trading style is, a very informative way to look at anything is using a fractal method. For intraday trading, 2min, 5min, 15min and even one hour charts all with a Fractal energy reading and fractal pivots allows you to easily see the trading patterns and reversal or polarity changes. In other words When higher highs and higher lows are compressing to random sideways action with possible trend changes or just short term aggregations building energy to press on in the trend direction.
In response to the query whether the Fractal Energy is the same concept as the Choppiness Index, if you graph the Choppiness index and the Fractal Linear Efficiency ... they are calculated differently but the shapes are nearly identical for most of their length.
Attachments
Last edited by a moderator:


