
mbarcala
Active member
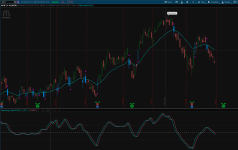
Another nice Indicator converted from Tradingview to TOS, Enjoy!
Original Link: https://www.tradingview.com/script/Q0eQz7ll-Fisher-Transform-Indicator-by-Ehlers-Strategy/
Photo
13500[/ATTACH]']

script
Original Link: https://www.tradingview.com/script/Q0eQz7ll-Fisher-Transform-Indicator-by-Ehlers-Strategy/
Photo
13500[/ATTACH]']
script
Code:
#Fisher20 Converted from TradingView by mbarcala
#Original Link: https://www.tradingview.com/script/Q0eQz7ll-Fisher-Transform-Indicator-by-Ehlers-Strategy/
#////////////////////////////////////////////////////////////
#//  Copyright by HPotter v1.0 01/07/2014
#//     Market prices do not have a Gaussian probability density function
#//     as many traders think. Their probability curve is not bell-shaped.
#//     But trader can create a nearly Gaussian PDF for prices by normalizing
#//     them or creating a normalized indicator such as the relative strength
#//     index and applying the Fisher transform. Such a transformed output
#//     creates the peak swings as relatively rare events.
#//     Fisher transform formula is: y = 0.5 * ln ((1+x)/(1-x))
#//     The sharp turning points of these peak swings clearly and unambiguously
#//     identify price reversals in a timely manner.
#////////////////////////////////////////////////////////////
#study(title="Fisher Transform Indicator by Ehlers Strategy", shorttitle="Fisher Transform Indicator by Ehlers")

declare lower;

input length = 20;

def hhigh = Highest(hl2, length);
def llow = Lowest(hl2, length);

def round = if 0 > .99 then .999 else if 0 < -.99 then -.999 else Double.NaN;

def value = round(.66 * ((hl2 - llow) / max(hhigh - llow, .001) - .5) + .67 * value[1]);

plot fish1 = .5 * log((1 + value) / max(1 - value, .001)) + .5 * IsNAN(0);

plot fish2 = fish1[1];

plot line15 = 1.5;
line15.SetDefaultColor(Color.DARK_RED);
line15.SetStyle(Curve.SHORT_DASH);

plot line75 = 0.75;
line75.SetDefaultColor(Color.DARK_GRAY);
line75.SetStyle(Curve.SHORT_DASH);

plot cline = 0;
cline.SetDefaultColor(Color.GRAY);
cline.SetStyle(Curve.SHORT_DASH);
cline.SetLineWeight(2);

plot line75n = -line75;
line75n.SetDefaultColor(Color.DARK_GRAY);
line75n.SetStyle(Curve.SHORT_DASH);

plot line15n = -line15;
line15n.SetDefaultColor(Color.DARK_RED);
line15n.SetStyle(Curve.SHORT_DASH);
Attachments
Last edited by a moderator:
