Finding the First and Last Bar of the day in ThinkorSwim

korygill

Well-known member
VIP
One would think finding the first and last bar of the day in thinkscript would be easy.

I struggled to identify the first and last bars WITH extended session on and extended session off in the same study. I wrote this study, GetDayValues, to help me debug how to identify these so I could track PreviousClose and DayOpen bars in Magic Fibonacci 1.272 Indicator for ThinkorSwim v2.

I ran into issues around GetTime(), RegularTradingStart(), and RegularTradingEnd() and sometimes thinkscript would go a little bonkers and break my study if I wrote code in a certain way, which seemed valid at the time.

Sidebar: I will submit a feature request to the thinkscript to add a few built-in boolean values like IsFirstRegularBar, IsLastRegularBar, IsFirstExtendedBar, IsLastExtendedBar, IsRegularSession, IsExtendedSession, etc.

So what did I finally use to determine this?

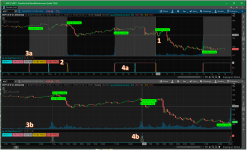
Image of the GetDayValues study in action

cjpjDFv.png


Discussion of the chart and numbed highlights

(1) Notice the cursor is on the first bar of the day
(2) Notice the colors of the labels and how they match the indicators in the lower studies
(3) Notice the values of the labels that are applicable on the highlighted first bar of the day
(4) Notice how the indicators differ on extended and non-extended charts

Once I plotted these values (some by trial and error), I was able to finally define FirstBarOfDay and LastBarOfDay and subsequently use those to track other values like previous close, opening bar, and for other studies like Opening Range, and others, these calculations could be very useful.

The secret sauce is in the following logic in the code:
Code:
#

# logic

#

def nan = Double.NaN;

def isRollover = GetYYYYMMDD() != GetYYYYMMDD()[1];

def beforeStart = GetTime() < RegularTradingStart(GetYYYYMMDD());

def afterEnd = GetTime() > RegularTradingEnd(GetYYYYMMDD());

def firstBarOfDay = if (beforeStart[1] == 1 and beforeStart == 0) or (isRollover and beforeStart == 0) then 1 else 0;

def lastBarOfDay = if

    (afterEnd[-1] == 1 and afterEnd == 0) or

    (isRollover[-1] and firstBarOfDay[-1])

    then 1

    else 0;

Once you see it, maybe it makes perfect sense. As previously discussed, it may not be that obvious to others, and was not obvious to me. I used things like GetDate() != GetDate()[1] and other things that hard-coded start of trading to 9:30 or 6:30 which varies based on your timezone.

So I am now hopeful that this pattern for finding first/last bars can be used as the de-facto standard for how to do this. If there is a better way that you know of, please feel free to share. I could not find one with a quick search of the internet, thinkscript docs, etc.

Link to GetDayValues Flex Grid

https://tos.mx/EXWUIK

Source Code for GetDayValues

Code:
# GetDayValues
# Author: Kory Gill, @korygill
#
# VERSION HISTORY (sortable date and time (your local time is fine), and your initials
# 20190823-1400-KG    - Created.
# ...
# ...
declare hide_on_daily;
declare once_per_bar;

input onUpper = yes;

#
# logic
#
def nan = Double.NaN;
def isRollover = GetYYYYMMDD() != GetYYYYMMDD()[1];
def beforeStart = GetTime() < RegularTradingStart(GetYYYYMMDD());
def afterEnd = GetTime() > RegularTradingEnd(GetYYYYMMDD());
def firstBarOfDay = if (beforeStart[1] == 1 and beforeStart == 0) or (isRollover and beforeStart == 0) then 1 else 0;
def lastBarOfDay = if
    (afterEnd[-1] == 1 and afterEnd == 0) or
    (isRollover[-1] and firstBarOfDay[-1])
    then 1
    else 0;

#
# Identify first bar of day and last bar of day on chart
#
AddChartBubble(
    firstBarOfDay and onUpper,
    close,
    "First Bar of Day",
    Color.GREEN,
    yes);

AddChartBubble(
    lastBarOfDay and onUpper,
    close,
    "Last Bar of Day",
    Color.GREEN,
    no);

#
# plots
#
plot p1 = if !onUpper then isRollover else nan;
plot p2 = if !onUpper then beforeStart else nan;
plot p3 = if !onUpper then afterEnd else nan;
plot p4 = if !onUpper then firstBarOfDay else nan;
plot p5 = if !onUpper then lastBarOfDay else nan;

p1.SetDefaultColor(GetColor(1));
p2.SetDefaultColor(GetColor(2));
p3.SetDefaultColor(GetColor(3));
p4.SetDefaultColor(GetColor(4));
p5.SetDefaultColor(GetColor(5));

AddLabel(!onUpper, "isRollOver", GetColor(1));
AddLabel(!onUpper, "beforeStart", GetColor(2));
AddLabel(!onUpper, "afterEnd", GetColor(3));
AddLabel(!onUpper, "firstBarOfDay", GetColor(4));
AddLabel(!onUpper, "lastBarOfDay", GetColor(5));

Disclaimer and Notices

You are free to use this code for personal use, and make derivative works from it. You are also GRANTED permission to use this code (or derivative works) for commercial purposes which includes and is not limited to selling, reselling, or packaging with other commercial indicators. Headers and attribution in this code should remain as provided, and any derivative works should extend the existing headers.
 

Attachments

  • cjpjDFv.png
    cjpjDFv.png
    427 KB · Views: 517
Nice work. Also for some cases there is one trick for finding last bar. One advantage of that method is that TOS doesnt flag it as "too complex" (which happens whenever highestall is used):
Code:
def isLastBar = !IsNaN(close) and IsNaN(close[-1]);
 
Hello, @korygill , would it be possible to adapt this code to find the first daily bar of each month?. or the first weekly bar of each quarter/year? or the first 10 minutes bar of week?
Thanks in advance for your help.
Best regards.
ps: English is not my mother tongue; please excuse any errors on my part.
 
Last edited:
Hello, @korygill , would it be possible to adapt this code to find the first daily bar of each month?. or the first weekly bar of each quarter/year? or the first 10 minutes bar of week?
Thanks in advance for your help.
Best regards.
ps: English is not my mother tongue; please excuse any errors on my part.

Here is the study for the first bar of the month, run this on a daily aggregation

Code:
def mth = GetMonth();
plot newMonth = mth != mth[1];
newMonth.SetPaintingStrategy(PaintingStrategy.BOOLEAN_ARROW_UP);
newMonth.SetDefaultColor(Color.YELLOW);
newMonth.SetLineWeight(3);
 
Thanks for this! Another great code snippet block that is very useful. I also ran into some problems with my RTH paramaters when coding strategies. This did the trick around a glitch that sometimes occured. Also thanks @skynetgen for the additional code. Will play around with that one too.
 
@leakywaders It does take a while but slowly but surely you'll soon put together your toolkit to be able to write scripts for every situation. I'm still learning every single day!
 
Hi korygill,
Your code is great but how do we find one before the last bar. I am looking to close intraday position before the EOD close. If we use last bar of the day thinkscript will close on next bar open which is next day. thank you!!!!!
 
@SimpleStock, we can add this easily by using an offset on a couple calculations.

Code:
# GetDayValues
# Author: Kory Gill, @korygill
#
# VERSION HISTORY (sortable date and time (your local time is fine), and your initials
# 20190823-1400-KG    - Created.
# 20200109-1300-KG    - Added Offset to squish bars inward.
# ...
# ...
declare hide_on_daily;
declare once_per_bar;

input onUpper = yes;
input Offset = 0; #hint Offset: use this to squeeze the Nth bar inwards.

def rth = (RegularTradingEnd(GetYYYYMMDD()) - RegularTradingStart(GetYYYYMMDD())) / AggregationPeriod.HOUR;
AddLabel(yes, "RTH duration (hrs): " + rth);

#
# logic
#
def nan = Double.NaN;
def isRollover = GetYYYYMMDD() != GetYYYYMMDD()[1];
def beforeStart = GetTime() < RegularTradingStart(GetYYYYMMDD());
def afterEnd = GetTime() > RegularTradingEnd(GetYYYYMMDD());
def firstBarOfDay = if
    (beforeStart[1+offset] == 1 and beforeStart[offset] == 0) or
    (isRollover[offset] and beforeStart[offset] == 0)
    then 1
    else 0;
def lastBarOfDay = if
    (afterEnd[-1-offset] == 1 and afterEnd[offset] == 0) or
    (isRollover[-1-offset] and firstBarOfDay[-1-offset])
    then 1
    else 0;

#
# Identify first bar of day and last bar of day on chart
#
AddChartBubble(
    firstBarOfDay and onUpper,
    close,
    "FB",
    Color.GREEN,
    yes);

AddChartBubble(
    lastBarOfDay and lastBarOfDay[1] == 0 and onUpper,
    close,
    "LB",
    Color.GREEN,
    no);

#
# plots
#
plot p1 = if !onUpper then isRollover else nan;
plot p2 = if !onUpper then beforeStart else nan;
plot p3 = if !onUpper then afterEnd else nan;
plot p4 = if !onUpper then firstBarOfDay else nan;
plot p5 = if !onUpper then lastBarOfDay else nan;

p1.SetDefaultColor(GetColor(1));
p2.SetDefaultColor(GetColor(2));
p3.SetDefaultColor(GetColor(3));
p4.SetDefaultColor(GetColor(4));
p5.SetDefaultColor(GetColor(5));

AddLabel(!onUpper, "isRollOver", GetColor(1));
AddLabel(!onUpper, "beforeStart", GetColor(2));
AddLabel(!onUpper, "afterEnd", GetColor(3));
AddLabel(!onUpper, "firstBarOfDay", GetColor(4));
AddLabel(!onUpper, "lastBarOfDay", GetColor(5));

kZXHzDE.png
 
Excellent! This will help everyone programming day trading systems that wants to close open positions by the EOD.
thank you so much!
 
Anyone know a way to adapt this script to measure the volume on a specific bar?

I am looking to build a script that gives me the average volume of the first 6 candles on a 5 min /ES chart and provides a label accordingly to try to identify what is likely to be a trending or a choppy day for the market. Here is what I have, and I'm clearly stuck and know there must be a simple solution:

Code:
def nan = Double.NaN;

def isRollover = GetYYYYMMDD() != GetYYYYMMDD()[1];

def beforeStart = GetTime() < RegularTradingStart(GetYYYYMMDD());

def afterEnd = GetTime() > RegularTradingEnd(GetYYYYMMDD());

def firstBarOfDay = if (beforeStart[1] == 1 and beforeStart == 0) or (isRollover and beforeStart == 0) then 1 else 0;

def lastBarOfDay = if

    (afterEnd[-1] == 1 and afterEnd == 0) or

    (isRollover[-1] and firstBarOfDay[-1])

    then 1

    else 0;

def choppy = if firstBarOfDay == 1 and ((volume("/ES", period = AggregationPeriod.FIVE_MIN)[1] + volume("/ES", period = AggregationPeriod.FIVE_MIN)[2] + volume("/ES", period = AggregationPeriod.FIVE_MIN)[3] + volume("/ES", period = AggregationPeriod.FIVE_MIN)[4] + volume("/ES", period = AggregationPeriod.FIVE_MIN)[5] + volume("/ES", period = AggregationPeriod.FIVE_MIN)[6]) / 6) < 25000 then 1 else 0;

AddLabel(choppy == 1, text = "Choppy Market", color = Color.GRAY);

AddLabel(choppy == 0, text = "Trending Market", color = Color.GREEN);
 
@TraderKevin as requested here is your scan with label rounded to the nearest whole number from the tenths of a decimal.
Plots as a label the value of the average of the first 6 volume bars of each new daily REGULAR HOUR trading session. Can use on any time frame under a day. Set your timeframe to 5 min chart and it will adjust for 5 mins.

Code:
##Thinkscript by XeoNoX via https://usethinkscript.com/
#Plots as a label the value of the average of the first 6 volume bars of each new daily REGULAR HOUR trading session.

def isRollover = GetYYYYMMDD() != GetYYYYMMDD()[1];

def beforeStart = GetTime() < RegularTradingStart(GetYYYYMMDD());

def afterEnd = GetTime() > RegularTradingEnd(GetYYYYMMDD());

####DEFINES FIRST 6 BARS OF REGULAR SESSION
def firstBar1 = if (beforeStart[1] == 1 and beforeStart == 0) or (isRollover and beforeStart == 0) then 1 else 0;
def firstBar2 = if (beforeStart[2] == 1 and beforeStart == 0) or (isRollover and beforeStart == 0) then 1 else 0;
def firstBar3 = if (beforeStart[3] == 1 and beforeStart == 0) or (isRollover and beforeStart == 0) then 1 else 0;
def firstBar4 = if (beforeStart[4] == 1 and beforeStart == 0) or (isRollover and beforeStart == 0) then 1 else 0;
def firstBar5 = if (beforeStart[5] == 1 and beforeStart == 0) or (isRollover and beforeStart == 0) then 1 else 0;
def firstBar6 = if (beforeStart[6] == 1 and beforeStart == 0) or (isRollover and beforeStart == 0) then 1 else 0;

##RECORDS AND GRABS VALUE OF THE REFERENCED VOLUME BAR
rec firstBarVolume = if firstBar1 then volume else firstBarVolume[1];
rec firstBarVolume2 = if firstBar2 then volume else firstBarVolume2[1];
rec firstBarVolume3 = if firstBar3 then volume else firstBarVolume3[1];
rec firstBarVolume4 = if firstBar4 then volume else firstBarVolume4[1];
rec firstBarVolume5 = if firstBar5 then volume else firstBarVolume5[1];
rec firstBarVolume6 = if firstBar6 then volume else firstBarVolume6[1];

### SUMS UP ALL 6 BARS and then AVERAGES THEM BY DIVIDING BY 6
def scan = (firstbarvolume + firstbarvolume2 +firstbarvolume3 + firstbarvolume4 + firstbarvolume5 + firstbarvolume6) / 6;

##PLOTS THE BARS THAT ARE BEING COUNTED
plot barcount = firstbarvolume6;

#LABEL OF Scan Rounded to the nearest Decimal.
AddLabel(yes, " Avg of First 6 vol bars: " + Round(scan,0), Color.yellow);


KKi0xVq.png
 
Last edited:
Hello @XeoNoX, How would you go about getting the first bar volume of a 10 day period?

I tried doing barcount(period = "DAY")[1] + etc etc but apparently it only works with fundamentals.

This is amazing work, I wish I have expert coding knowledge like people in here.
 
Last edited:
im confused, you are looking for the value of the volume bar from 10 bars/days ago?

or are you looking intraday for the volume value for the prior tenth's day's first volume bar?
 
im confused, you are looking for the value of the volume bar from 10 bars/days ago?

or are you looking intraday for the volume value for the prior tenth's day's first volume bar?

XeoNox, Thanks for the response and I'm Sorry for the confusion.

To make it easier for me to explain, lets say today is Monday and we are looking at a 5m Chart, so what I am trying to achieve is to find the first 5 minute Volume bar of Last weeks Monday and the first 5 minute volume bar of Last weeks Tuesday etc etc and then I would get the average and compare to Todays First 5 minute Volume bar.

I guess the goal I'm trying to achieve here is to Identify the average trading volume in the first 5 minutes in the past 5 days and then compare it to the current days first 5 min volume.

I hope that makes sense.
 
Last edited:
Not to throw a monkey wrench into the discussion, but on NASDAQ 100 futures, there are a handful of different times. A daily candle is drawn with the OPEN as 5:00 PM Central the day before. The CLOSE is 4:00 PM Central of that day. Then there is the New York open at 8:30 AM Central, and the NY close at 3:15 PM Central. The 3:15 PM close is used as the basis for the next day's price +/- move. I know, confusing, LOL. For a different discussion topic, I've been tracking the moves in the US "night-morning" (5:00 PM Central to 8:30 AM Central) and the moves that we have been waking up to in the US are incredible. 100-300 point moves before we even start trading. Does anyone trade in the night-morning? $1000s on the table before we eat breakfast, LOL. Probably Europe trading, or young 3rd shifters that love trading at night, or Algos (probable answer). Also, I hope traders here have been catching those 100s point moves in the NQ. A few days it was almost too easy. Futures started a hard, steady ramp and didn't hesitate for a hour or two.
 
Last edited:
XeoNox, Thanks for the response and I'm Sorry for the confusion.

To make it easier for me to explain, lets say today is Monday and we are looking at a 5m Chart, so what I am trying to achieve is to find the first 5 minute Volume bar of Last weeks Monday and the first 5 minute volume bar of Last weeks Tuesday etc etc and then I would get the average and compare to Todays First 5 minute Volume bar.

I guess the goal I'm trying to achieve here is to Identify the average trading volume in the first 5 minutes in the past 5 days and then compare it to the current days first 5 min volume.

I hope that makes sense.
I think it sounds like you are looking for something like this:
https://usethinkscript.com/threads/yesterdays-volume-vs-todays-volume-at-same-time-indicator.317/
 

Join useThinkScript to post your question to a community of 21,000+ developers and traders.

Similar threads

Not the exact question you're looking for?

Start a new thread and receive assistance from our community.

87k+ Posts
429 Online
Create Post

Similar threads

Similar threads

The Market Trading Game Changer

Join 2,500+ subscribers inside the useThinkScript VIP Membership Club
  • Exclusive indicators
  • Proven strategies & setups
  • Private Discord community
  • ‘Buy The Dip’ signal alerts
  • Exclusive members-only content
  • Add-ons and resources
  • 1 full year of unlimited support

Frequently Asked Questions

What is useThinkScript?

useThinkScript is the #1 community of stock market investors using indicators and other tools to power their trading strategies. Traders of all skill levels use our forums to learn about scripting and indicators, help each other, and discover new ways to gain an edge in the markets.

How do I get started?

We get it. Our forum can be intimidating, if not overwhelming. With thousands of topics, tens of thousands of posts, our community has created an incredibly deep knowledge base for stock traders. No one can ever exhaust every resource provided on our site.

If you are new, or just looking for guidance, here are some helpful links to get you started.

What are the benefits of VIP Membership?
VIP members get exclusive access to these proven and tested premium indicators: Buy the Dip, Advanced Market Moves 2.0, Take Profit, and Volatility Trading Range. In addition, VIP members get access to over 50 VIP-only custom indicators, add-ons, and strategies, private VIP-only forums, private Discord channel to discuss trades and strategies in real-time, customer support, trade alerts, and much more. Learn all about VIP membership here.
How can I access the premium indicators?
To access the premium indicators, which are plug and play ready, sign up for VIP membership here.
Back
Top