#StudyName:     BLT_HarndogLazyFractalPivotsV2
#Version/Date:    v2 01-13-2016                  TOS.mx Link: http://tos.mx/P0dS0H
#Type:             [Study | Strategy]
#Description:   Instead of redrafting fractal pivots to frame market behavior
#                this adaption of Mobius' FractalPivotsArrayV3 was modified by
#                by BLT/ZZZ/LB using a Harndog test script idea to generate
#                lazy fractal pivot lines.
#Requested By:  Harndog in chat starting around 02/12/17
#History:                        TOS.mx Link:
# Notes:        The idea is based on Mobius Fractal Pivot Array http://tos.mx/Yf06LY
# Annotation:
# V02: Added ExtLine.Hide: because script was generating expansion problems
#      Changed Plot Support Line (line 450) to
#      plot SupportLine = if bar == ParentHbarOrigin
#                   then ParentHigh
#                   else if bar == ParentLbarOrigin
#                        then ParentLow
#                        else double.nan;
# Suggestion from Brian_ss
# Trading Notes: Play with the script properties to adjust fractal pivots,
#               aggregations
# 18:58 blt_: harndog, if you still are looking for hiding pivots in your version of "lazy pivots", maybe this will help. It hides pivots when a close crosses the pivot. You can set how many crosses before a line is hidden. The bubble was also set to hide if the pivot line is hidden. The current/higher option was changed to allow for more


# Fractal Pivot Array 11 deep
# Mobius
# V03.01.2017
# V02: Added some information on Basic Wave Structure and labels to hold wave data started
# V03: Added User Input for secondary aggregations. Add a label to show what chart aggregation pivots are being plotted. Add a cloud to show first zone of support / resistance. Altered Support line plot to extend at a consistent slope. Reset UI's for WaveLabel and ShowWaves to no.


# User Inputs
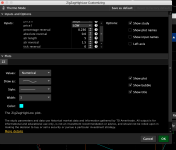
input n = 10;
input WaveLabel = no;
input ShowWaves = no;
input ShowSupportResistanceCloud = yes;
input select_aggperiod = {default "Current", "Higher"};
input higheragg = aggregationPeriod.THREE_MIN;
input sethiding_crosses_required = 1;
def   sh = sethiding_crosses_required;


# Internal Script Reference
script LinePlot {
    input BarID = 0;
    input Value = 0;
    input BarOrigin = 0;
    def ThisBar = HighestAll(BarOrigin);
    def ValueLine = if BarOrigin == ThisBar
                then Value
                else Double.NaN;
    plot P = if ThisBar - BarID <= BarOrigin
             then HighestAll(ValueLine)
             else Double.NaN;
}
# Variables
def o;
def h;
def l;
def c;
switch (select_aggperiod) {
case current:
       o = open;
       h = high;
       l = low;
       c = if isnan(close) then c[1] else close;
case higher:
       o = open(period = higheragg);
       h = high(period = higheragg);
       l = low(period = higheragg);
       c = if isnan(close(period = higheragg)) then c[1] else close(period = higheragg) ;
}
addLabel(1, "Aggregation for Pivots at "+if select_aggperiod==select_aggperiod."current" then "current" else +higheragg/60000+"min"+" chart", color.white);
def bar = BarNumber();
def BBar = bar == HighestAll(bar);
# Parent High
def ParentHigh = HighestAll(h);
def ParentHBarOrigin = if h == ParentHigh
                       then bar
                       else ParentHBarOrigin[1];
def ParentHBarID = bar - HighestAll(ParentHBarOrigin);
# R1
def hh = fold i = 1 to n + 1
         with p = 1
         while p
         do h > GetValue(h, -i);
def PivotH = if (bar > n and
                 h == Highest(h, n) and
                 hh)
            then h
            else Double.NaN;
def PHValue = if !IsNaN(PivotH)
              then PivotH
              else PHValue[1];
def PHBarOrigin = if !IsNaN(PivotH)
                  then bar
                  else PHBarOrigin[1];
def PHBarID = bar - PHBarOrigin;
# R2
def R2PHValue = if PHBarOrigin != PHBarOrigin[1]
              then PHValue[1]
              else R2PHValue[1];
def R2PHBarOrigin = if PHBarOrigin != PHBarOrigin[1]
                  then PHBarOrigin[1]
                  else R2PHBarOrigin[1];
def R2PHBarID = bar - R2PHBarOrigin;
# R3
def R3PHValue = if R2PHBarOrigin != R2PHBarOrigin[1]
              then R2PHValue[1]
              else R3PHValue[1];
def R3PHBarOrigin = if R2PHBarOrigin != R2PHBarOrigin[1]
                  then R2PHBarOrigin[1]
                  else R3PHBarOrigin[1];
def R3PHBarID = bar - R3PHBarOrigin;
# R4
def R4PHValue = if R3PHBarOrigin != R3PHBarOrigin[1]
              then R3PHValue[1]
              else R4PHValue[1];
def R4PHBarOrigin = if R3PHBarOrigin != R3PHBarOrigin[1]
                  then R3PHBarOrigin[1]
                  else R4PHBarOrigin[1];
def R4PHBarID = bar - R4PHBarOrigin;
# R5
def R5PHValue = if R4PHBarOrigin != R4PHBarOrigin[1]
              then R4PHValue[1]
              else R5PHValue[1];
def R5PHBarOrigin = if R4PHBarOrigin != R4PHBarOrigin[1]
                  then R4PHBarOrigin[1]
                  else R5PHBarOrigin[1];
def R5PHBarID = bar - R5PHBarOrigin;
# R6
def R6PHValue = if R5PHBarOrigin != R5PHBarOrigin[1]
              then R5PHValue[1]
              else R6PHValue[1];
def R6PHBarOrigin = if R5PHBarOrigin != R5PHBarOrigin[1]
                  then R5PHBarOrigin[1]
                  else R6PHBarOrigin[1];
def R6PHBarID = bar - R6PHBarOrigin;
# R5
def R7PHValue = if R6PHBarOrigin != R6PHBarOrigin[1]
              then R6PHValue[1]
              else R7PHValue[1];
def R7PHBarOrigin = if R6PHBarOrigin != R6PHBarOrigin[1]
                  then R6PHBarOrigin[1]
                  else R7PHBarOrigin[1];
def R7PHBarID = bar - R7PHBarOrigin;
# R8
def R8PHValue = if R7PHBarOrigin != R7PHBarOrigin[1]
              then R7PHValue[1]
              else R8PHValue[1];
def R8PHBarOrigin = if R7PHBarOrigin != R7PHBarOrigin[1]
                  then R7PHBarOrigin[1]
                  else R8PHBarOrigin[1];
def R8PHBarID = bar - R8PHBarOrigin;
# R9
def R9PHValue = if R8PHBarOrigin != R8PHBarOrigin[1]
              then R8PHValue[1]
              else R9PHValue[1];
def R9PHBarOrigin = if R8PHBarOrigin != R8PHBarOrigin[1]
                  then R8PHBarOrigin[1]
                  else R9PHBarOrigin[1];
def R9PHBarID = bar - R9PHBarOrigin;
# R10
def R10PHValue = if R9PHBarOrigin != R9PHBarOrigin[1]
              then R9PHValue[1]
              else R10PHValue[1];
def R10PHBarOrigin = if R9PHBarOrigin != R9PHBarOrigin[1]
                  then R9PHBarOrigin[1]
                  else R10PHBarOrigin[1];
def R10PHBarID = bar - R10PHBarOrigin;


# Parent Low
def ParentLow = LowestAll(l);
def ParentLBarOrigin = if l == ParentLow
                       then bar
                       else ParentLBarOrigin[1];
def ParentLBarID = bar - ParentLBarOrigin;
# S1
def ll = fold j = 1 to n + 1
         with q = 1
         while q
         do l < GetValue(l, -j);
def PivotL = if (bar > n and
                 l == Lowest(l, n) and
                 ll)
             then l
             else Double.NaN;
def PLValue = if !IsNaN(PivotL)
              then PivotL
              else PLValue[1];
def PLBarOrigin = if !IsNaN(PivotL)
                  then bar
                  else PLBarOrigin[1];
def PLBarID = bar - PLBarOrigin;
# S2
def S2PLValue = if PLBarOrigin != PLBarOrigin[1]
              then PLValue[1]
              else S2PLValue[1];
def S2PLBarOrigin = if PLBarOrigin != PLBarOrigin[1]
                  then PLBarOrigin[1]
                  else S2PLBarOrigin[1];
def S2PLBarID = bar - S2PLBarOrigin;
# S3
def S3PLValue = if S2PLBarOrigin != S2PLBarOrigin[1]
              then S2PLValue[1]
              else S3PLValue[1];
def S3PLBarOrigin = if S2PLBarOrigin != S2PLBarOrigin[1]
                  then S2PLBarOrigin[1]
                  else S3PLBarOrigin[1];
def S3PLBarID = bar - S3PLBarOrigin;
# S4
def S4PLValue = if S3PLBarOrigin != S3PLBarOrigin[1]
              then S3PLValue[1]
              else S4PLValue[1];
def S4PLBarOrigin = if S3PLBarOrigin != S3PLBarOrigin[1]
                  then S3PLBarOrigin[1]
                  else S4PLBarOrigin[1];
def S4PLBarID = bar - S4PLBarOrigin;
# S5
def S5PLValue = if S4PLBarOrigin != S4PLBarOrigin[1]
              then S4PLValue[1]
              else S5PLValue[1];
def S5PLBarOrigin = if S4PLBarOrigin != S4PLBarOrigin[1]
                  then S4PLBarOrigin[1]
                  else S5PLBarOrigin[1];
def S5PLBarID = bar - S5PLBarOrigin;
# S6
def S6PLValue = if S5PLBarOrigin != S5PLBarOrigin[1]
              then S5PLValue[1]
              else S6PLValue[1];
def S6PLBarOrigin = if S5PLBarOrigin != S5PLBarOrigin[1]
                  then S5PLBarOrigin[1]
                  else S6PLBarOrigin[1];
def S6PLBarID = bar - S6PLBarOrigin;
# S7
def S7PLValue = if S6PLBarOrigin != S6PLBarOrigin[1]
              then S6PLValue[1]
              else S7PLValue[1];
def S7PLBarOrigin = if S6PLBarOrigin != S6PLBarOrigin[1]
                  then S6PLBarOrigin[1]
                  else S7PLBarOrigin[1];
def S7PLBarID = bar - S7PLBarOrigin;
# S8
def S8PLValue = if S7PLBarOrigin != S7PLBarOrigin[1]
              then S7PLValue[1]
              else S8PLValue[1];
def S8PLBarOrigin = if S7PLBarOrigin != S7PLBarOrigin[1]
                  then S7PLBarOrigin[1]
                  else S8PLBarOrigin[1];
def S8PLBarID = bar - S8PLBarOrigin;
# S9
def S9PLValue = if S8PLBarOrigin != S8PLBarOrigin[1]
              then S8PLValue[1]
              else S9PLValue[1];
def S9PLBarOrigin = if S8PLBarOrigin != S8PLBarOrigin[1]
                  then S8PLBarOrigin[1]
                  else S9PLBarOrigin[1];
def S9PLBarID = bar - S9PLBarOrigin;
# S10
def S10PLValue = if S9PLBarOrigin != S9PLBarOrigin[1]
              then S9PLValue[1]
              else S10PLValue[1];
def S10PLBarOrigin = if S9PLBarOrigin != S9PLBarOrigin[1]
                  then S9PLBarOrigin[1]
                  else S10PLBarOrigin[1];
def S10PLBarID = bar - S10PLBarOrigin;


# Plots
plot PR1 = LinePlot(BarID = ParentHBarID,
                    Value = ParentHigh,
                    BarOrigin = HighestAll(ParentHBarOrigin));
PR1.SetDefaultColor(Color.GREEN);
addChartBubble(Bar == HighestAll(ParentHBarOrigin), ParentHigh, "B", color.yellow, 1);
plot R1 = LinePlot(BarID = PHBarID,
                   Value = PHValue,
                   BarOrigin = PHBarOrigin);
R1.SetDefaultColor(Color.GREEN);
def r1v=if bar==highestall(phbarorigin) then h else r1v[1];
def crossr1=if bar<HighestAll(PHBarOrigin) then 0 else if bar>HighestAll(PHBarOrigin) and c crosses highestall(r1v) then crossr1[1]+1 else crossr1[1];
r1.sethiding(crossr1>=sh);
addChartBubble(highestall(crossr1)<sh and Bar == HighestAll(PHBarOrigin), PHvalue, "R1", color.green, 1);
plot R2 = LinePlot(BarID = R2PHBarID,
                   Value = R2PHValue,
                   BarOrigin = R2PHBarOrigin);
R2.SetDefaultColor(Color.GREEN);
def r2v=if bar==highestall(r2phbarorigin) then h else r2v[1];
def crossr2=if bar<HighestAll(R2PHBarOrigin) then 0 else if bar>HighestAll(r2PHBarOrigin) and c crosses highestall(r2v) then crossr2[1]+1 else crossr2[1];
r2.sethiding(crossr2>=sh);
addChartBubble(highestall(crossr2)<sh and Bar == HighestAll(R2PHBarOrigin), PHvalue, "R2", color.green, 1);
plot R3 = LinePlot(BarID = R3PHBarID,
                   Value = R3PHValue,
                   BarOrigin = R3PHBarOrigin);
R3.SetDefaultColor(Color.GREEN);
def r3v=if bar==highestall(r3phbarorigin) then h else r3v[1];
def crossr3=if bar<HighestAll(R3PHBarOrigin) then 0 else if bar>HighestAll(R3PHBarOrigin) and c crosses highestall(r3v) then crossr3[1]+1 else crossr3[1];
r3.sethiding(crossr3>=sh);
addChartBubble(highestall(crossr3)<sh and Bar == HighestAll(R3PHBarOrigin), PHvalue, "R3", color.green, 1);
plot R4 = LinePlot(BarID = R4PHBarID,
                   Value = R4PHValue,
                   BarOrigin = R4PHBarOrigin);
R4.SetDefaultColor(Color.GREEN);
def r4v=if bar==highestall(r4phbarorigin) then h else r4v[1];
def crossr4=if bar<HighestAll(R4PHBarOrigin) then 0 else if bar>HighestAll(R4PHBarOrigin) and c crosses highestall(r4v) then crossr4[1]+1 else crossr4[1];
r4.sethiding(crossr4>=sh);
addChartBubble(highestall(crossr4)<sh and Bar == HighestAll(R4PHBarOrigin), PHvalue, "R4", color.green, 1);
plot R5 = LinePlot(BarID = R5PHBarID,
                   Value = R5PHValue,
                   BarOrigin = R5PHBarOrigin);
R5.SetDefaultColor(Color.GREEN);
def r5v=if bar==highestall(r5phbarorigin) then h else r5v[1];
def crossr5=if bar<HighestAll(R5PHBarOrigin) then 0 else if bar>HighestAll(R5PHBarOrigin) and c crosses highestall(r5v) then crossr5[1]+1 else crossr5[1];
r5.sethiding(crossr5>=sh);
addChartBubble(highestall(crossr5)<sh and Bar == HighestAll(R5PHBarOrigin), PHvalue, "R5", color.green, 1);
plot R6 = LinePlot(BarID = R6PHBarID,
                   Value = R6PHValue,
                   BarOrigin = R6PHBarOrigin);
R6.SetDefaultColor(Color.GREEN);
def r6v=if bar==highestall(r6phbarorigin) then h else r6v[1];
def crossr6=if bar<HighestAll(R6PHBarOrigin) then 0 else if bar>HighestAll(R6PHBarOrigin) and c crosses highestall(r6v) then crossr6[1]+1 else crossr6[1];
r6.sethiding(crossr6>=sh);
addChartBubble(highestall(crossr6)<sh and Bar == HighestAll(R6PHBarOrigin), PHvalue, "R6", color.green, 1);
plot R7 = LinePlot(BarID = R7PHBarID,
                   Value = R7PHValue,
                   BarOrigin = R7PHBarOrigin);
R7.SetDefaultColor(Color.GREEN);
def r7v=if bar==highestall(r7phbarorigin) then h else r7v[1];
def crossr7=if bar<HighestAll(R7PHBarOrigin) then 0 else if bar>HighestAll(R7PHBarOrigin) and c crosses highestall(r7v) then crossr7[1]+1 else crossr7[1];
r7.sethiding(crossr7>=sh);
addChartBubble(highestall(crossr7)<sh and Bar == HighestAll(R7PHBarOrigin), PHvalue, "R7", color.green, 1);
plot R8 = LinePlot(BarID = R8PHBarID,
                   Value = R8PHValue,
                   BarOrigin = R8PHBarOrigin);
R8.SetDefaultColor(Color.GREEN);
def r8v=if bar==highestall(r8phbarorigin) then h else r8v[1];
def crossr8=if bar<HighestAll(R8PHBarOrigin) then 0 else if bar>HighestAll(R8PHBarOrigin) and c crosses highestall(r8v) then crossr8[1]+1 else crossr8[1];
r8.sethiding(crossr8>=sh);
addChartBubble(highestall(crossr8)<sh and Bar == HighestAll(R8PHBarOrigin), PHvalue, "R8", color.green, 1);
plot R9 = LinePlot(BarID = R9PHBarID,
                   Value = R9PHValue,
                   BarOrigin = R9PHBarOrigin);
R9.SetDefaultColor(Color.GREEN);
def r9v=if bar==highestall(r9phbarorigin) then h else r9v[1];
def crossr9=if bar<HighestAll(R9PHBarOrigin) then 0 else if bar>HighestAll(R9PHBarOrigin) and c crosses highestall(r9v) then crossr9[1]+1 else crossr9[1];
r9.sethiding(crossr9>=sh);
addChartBubble(highestall(crossr9)<sh and Bar == HighestAll(R9PHBarOrigin), PHvalue, "R9", color.green, 1);
plot R10 = LinePlot(BarID = R10PHBarID,
                   Value = R10PHValue,
                   BarOrigin = R10PHBarOrigin);
R10.SetDefaultColor(Color.GREEN);
def r10v=if bar==highestall(r10phbarorigin) then h else r10v[1];
def crossr10=if bar<HighestAll(R10PHBarOrigin) then 0 else if bar>HighestAll(R10PHBarOrigin) and c crosses highestall(r10v) then crossr10[1]+1 else crossr10[1];
r10.sethiding(crossr10>=sh);
addChartBubble(highestall(crossr10)<sh and Bar == HighestAll(R10PHBarOrigin), PHvalue, "R10", color.green, 1);


plot PS1 = LinePlot(BarID = ParentLBarID,
                   Value = ParentLow,
                   BarOrigin = HighestAll(ParentLBarOrigin));
PS1.SetDefaultColor(Color.RED);
AddChartBubble(Bar == HighestAll(ParentLBarOrigin), ParentLow, "A", Color.Yellow, 0);
plot S1 = LinePlot(BarID = PLBarID,
                   Value = PLValue,
                   BarOrigin = PLBarOrigin);
S1.SetDefaultColor(Color.RED);
def s1v=if bar==highestall(plbarorigin) then l else s1v[1];
def crosss1=if bar<HighestAll(plBarOrigin) then 0 else if bar>HighestAll(plBarOrigin) and c crosses highestall(s1v) then crosss1[1]+1 else crosss1[1];
s1.sethiding(crosss1>=sh);
addChartBubble(highestall(crosss1)<sh and Bar == HighestAll(PLBarOrigin), PLvalue, "S1", color.red, 0);
plot S2 = LinePlot(BarID = S2PLBarID,
                   Value = S2PLValue,
                   BarOrigin = S2PLBarOrigin);
S2.SetDefaultColor(Color.RED);
def s2v=if bar==highestall(s2plbarorigin) then l else s2v[1];
def crosss2=if bar<HighestAll(s2plBarOrigin) then 0 else if bar>HighestAll(s2plBarOrigin) and c crosses highestall(s2v) then crosss2[1]+1 else crosss2[1];
s2.sethiding(crosss2>=sh);
addChartBubble(highestall(crosss2)<sh and Bar == HighestAll(S2PLBarOrigin), PLvalue, "S2", color.red, 0);
plot S3 = LinePlot(BarID = S3PLBarID,
                   Value = S3PLValue,
                   BarOrigin = S3PLBarOrigin);
S3.SetDefaultColor(Color.RED);
def s3v=if bar==highestall(s3plbarorigin) then l else s3v[1];
def crosss3=if bar<HighestAll(s3plBarOrigin) then 0 else if bar>HighestAll(s3plBarOrigin) and c crosses highestall(s3v) then crosss3[1]+1 else crosss3[1];
s3.sethiding(crosss3>=sh);
addChartBubble(highestall(crosss3)<sh and Bar == HighestAll(S3PLBarOrigin), PLvalue, "S3", color.red, 0);
plot S4 = LinePlot(BarID = S4PLBarID,
                   Value = S4PLValue,
                   BarOrigin = S4PLBarOrigin);
S4.SetDefaultColor(Color.RED);
def s4v=if bar==highestall(s4plbarorigin) then l else s4v[1];
def crosss4=if bar<HighestAll(s4plBarOrigin) then 0 else if bar>HighestAll(s4plBarOrigin) and c crosses highestall(s4v) then crosss4[1]+1 else crosss4[1];
s4.sethiding(crosss4>=sh);
addChartBubble(highestall(crosss4)<sh and Bar == HighestAll(S4PLBarOrigin), PLvalue, "S4", color.red, 0);
plot S5 = LinePlot(BarID = S5PLBarID,
                   Value = S5PLValue,
                   BarOrigin = S5PLBarOrigin);
S5.SetDefaultColor(Color.RED);
def s5v=if bar==highestall(s5plbarorigin) then l else s5v[1];
def crosss5=if bar<HighestAll(s5plBarOrigin) then 0 else if bar>HighestAll(s5plBarOrigin) and c crosses highestall(s5v) then crosss5[1]+1 else crosss5[1];
s5.sethiding(crosss5>=sh);
addChartBubble(highestall(crosss5)<sh and Bar == HighestAll(S5PLBarOrigin), PLvalue, "S5", color.red, 0);
plot S6 = LinePlot(BarID = S6PLBarID,
                   Value = S6PLValue,
                   BarOrigin = S6PLBarOrigin);
S6.SetDefaultColor(Color.RED);
def s6v=if bar==highestall(s6plbarorigin) then l else s6v[1];
def crosss6=if bar<HighestAll(s6plBarOrigin) then 0 else if bar>HighestAll(s6plBarOrigin) and c crosses highestall(s6v) then crosss6[1]+1 else crosss6[1];
s6.sethiding(crosss6>=sh);
addChartBubble(highestall(crosss6)<sh and Bar == HighestAll(S6PLBarOrigin), PLvalue, "S6", color.red, 0);
plot S7 = LinePlot(BarID = S7PLBarID,
                   Value = S7PLValue,
                   BarOrigin = S7PLBarOrigin);
S7.SetDefaultColor(Color.RED);
def s7v=if bar==highestall(s7plbarorigin) then l else s7v[1];
def crosss7=if bar<HighestAll(s7plBarOrigin) then 0 else if bar>HighestAll(s7plBarOrigin) and c crosses highestall(s7v) then crosss7[1]+1 else crosss7[1];
s7.sethiding(crosss7>=sh);
addChartBubble(highestall(crosss7)<sh and Bar == HighestAll(S7PLBarOrigin), PLvalue, "S7", color.red, 0);
plot S8 = LinePlot(BarID = S8PLBarID,
                   Value = S8PLValue,
                   BarOrigin = S8PLBarOrigin);
S8.SetDefaultColor(Color.RED);
def s8v=if bar==highestall(s8plbarorigin) then l else s8v[1];
def crosss8=if bar<HighestAll(s8plBarOrigin) then 0 else if bar>HighestAll(s8plBarOrigin) and c crosses highestall(s8v) then crosss8[1]+1 else crosss8[1];
s8.sethiding(crosss8>=sh);
addChartBubble(highestall(crosss8)<sh and Bar == HighestAll(S8PLBarOrigin), PLvalue, "S8", color.red, 0);
plot S9 = LinePlot(BarID = S9PLBarID,
                   Value = S9PLValue,
                   BarOrigin = S9PLBarOrigin);
def s9v=if bar==highestall(s9plbarorigin) then l else s9v[1];
def crosss9=if bar<HighestAll(s9plBarOrigin) then 0 else if bar>HighestAll(s9plBarOrigin) and c crosses highestall(s9v) then crosss9[1]+1 else crosss9[1];
s9.sethiding(crosss9>=sh);
addChartBubble(highestall(crosss9)<sh and Bar == HighestAll(S9PLBarOrigin), PLvalue, "S9", color.red, 0);
S9.SetDefaultColor(Color.RED);
plot S10 = LinePlot(BarID = S10PLBarID,
                   Value = S10PLValue,
                   BarOrigin = S10PLBarOrigin);
S10.SetDefaultColor(Color.RED);
def s10v=if bar==highestall(s10plbarorigin) then l else s10v[1];
def crosss10=if bar<HighestAll(s10plBarOrigin) then 0 else if bar>HighestAll(s10plBarOrigin) and c crosses highestall(s10v) then crosss10[1]+1 else crosss10[1];
s10.sethiding(crosss10>=sh);
addChartBubble(highestall(crosss10)<sh and Bar == HighestAll(S10PLBarOrigin), PLvalue, "S10", color.red, 0);


# End Code Fractal Array 11 Deep
# Trend Line
def PH_low = if bar == ParentHBarOrigin
             then l
             else PH_low[1];
def firstParentBar = Min(HighestAll(ParentLBarOrigin),
                         HighestAll(ParentHBarOrigin));
def lastParentBar = Max(HighestAll(ParentLBarOrigin),
                         HighestAll(ParentHBarOrigin));
def firstParent = if bar == firstParentBar and l == PH_low
                  then PH_low
                  else if bar == firstParentBar and l == ParentLow
                       then ParentLow
                  else firstParent[1];
def lastParent = if bar == lastParentBar and l == PH_low
                 then PH_low
                 else if bar == lastParentBar and l == ParentLow
                      then ParentLow
                 else lastParent[1];
def slope = (lastParent - firstParent) /
            (lastParentBar - firstParentBar);
plot SupportLine = if bar == ParentHbarOrigin
                   then ParentHigh
                   else if bar == ParentLbarOrigin
                        then ParentLow
                        else double.nan;
SupportLine.EnableApproximation();
SupportLine.SetDefaultColor(Color.Gray);
SupportLine.SetLineWeight(2);
SupportLine.SetStyle(Curve.LONG_DASH);
plot ExtLine = if bar >= lastParentBar
               then (bar - lastParentBar) * Slope + lastParent
               else double.nan;
ExtLine.EnableApproximation();
ExtLine.SetDefaultColor(Color.Gray);
ExtLine.SetLineWeight(2);
ExtLine.SetStyle(Curve.LONG_DASH);
ExtLine.Hide();
AddChartBubble(WaveLabel and bar == HighestAll(bar),
               HighestAll(High),
"Basic Elliott Wave Rules:" + "\n" +
"Wave (2) cannot retrace past the start of Wave (1)" + "\n" +
"Wave (3) cannot be the shortest wave in a 5 wave sequence." + "\n" +
"Wave (4) cannot retrace into Wave (1)" + "\n",
color.white, 1);
plot waves = if !isNaN(PivotH)
             then PivotH
             else if !isNaN(PivotL)
                  then PivotL
                  else double.nan;
     waves.SetStyle(Curve.Firm);
     waves.EnableApproximation();
     waves.SetDefaultColor(Color.Cyan);
     waves.SetLineWeight(2);
     waves.SetHiding(!ShowWaves);


# Wave Pattern
def ParentMaxBar = Max(ParentHBarOrigin, ParentLBarOrigin);
def ParentMinBar = Min(ParentLBarOrigin, ParentLBarOrigin);
def deltaPos = if ParentHBarOrigin == ParentMaxBar
               then 1
               else 0;
# Clouds
addCloud(if ShowSupportResistanceCloud then R1 else double.nan, S1, color.dark_gray, color.dark_gray);


