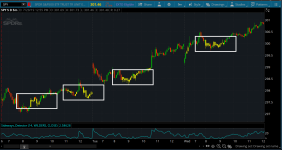
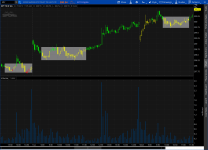
For those interested, here is a Choppiness Indicator that Mobius posted several years ago. This would be helpful for those who'd like another measure of defining trend, chop, etc
Updated version from 2015
Code:
# Choppiness Indicator
# Mobius
# V001.03.2012

#Hint: The Market is considered TRENDING when the index is below 38.2 \n The Market is considered CHOPPY when the index is above 61.8. \n A move above the 38.2 Level indicates a possible end to a trend and a move below 61.8 indicates a possible breakout from a period of consolidation.


declare lower;
input Length   = 14;
input Signal   =  3;
input Choppy   = 62;
input MidLine  = 50;
input Trending = 38;
input CIx = {default CIB, CIA};
   def CIA = 100 * log( Sum( TrueRange(high, close, low), Length))
             / ( Highest(close[1], Length) - Lowest(close[1], Length))
             / log(Length);
   def CIB = ((log(Sum(TrueRange(high, close, low), Length) /
             (Highest(if high >= close[1] then high else
             close[1], Length) -
             Lowest( if low <= close[1] then low else close[1], Length)))
             / log(10)) / (log(Length)/log(10))) * 100;
  plot CI = if CIx == CIx.CIB then CIB else CIA;
       CI.SetDefaultColor( Color.White);
  plot CIavg = average(CI, Signal);;
       CIavg.setdefaultColor(Color.Green);
  plot Chop = Choppy;
       Chop.SetDefaultColor(Color.red);
  plot Mid = MidLine;
       Mid.SetDefaultColor(Color.gray);
  plot Trend = Trending;
       Trend.SetDefaultColor(Color.green);
AddLabel(yes, if CI > MidLine then "CHOPPY " else "TRENDING ", if CI < Trend then Color.Green else if CI > Trend and CI < MidLine then Color.Light_Green else if CI > MidLine and CI < Chop then Color.Yellow else Color.Red);
Addcloud(Mid, Chop, Color.Green, Color.Yellow);
Addcloud(Trend, Mid, Color.Yellow, Color.Light_Green);
# END CODE #
Updated version from 2015
Code:
# Choppiness Index
# UpTheCreek
# 09.21.2015
# V 1.0

# Choppiness Index was developed by Australian commodity trader E.W. Dreiss
# and may be used to determine if the market is consolidating or trending.
# The Choppiness Index is a directionless indicator. Values above the upper
# guide (61.8) indicate that the market is moving sideways in a ranging or
# choppy manner. Values below the lower guide (38.2) indicate the market is
# trending.
#
# The CI measures the relationship between the Sum of daily trading ranges
# during a given period of time against the total range for that period.
# Low readings in the CI correspond closely with the end of strong impulsive
# movements either up OR down, while High readings occur after significant
# consolidations in the price. Extended periods of trendless price movement
# are reflected in extended periods of above-average readings of the CI.
#
# Bill Dreiss says "high CI readings can be used to indicate that a
# consolidation is about to end and a position should be entered or a
# breakout anticipated. Since the CI reading has nothing to do with market
# direction, it does NOT indicate in which direction to expect the breakout,
# but that the breakout will probably be followed by a significant move.)
# In this respect, the CI is similar in usage to Bollinger Band width (%B).
#
# Commodity Traders Consumer Report, July/August, 1992, Bill Dreiss “The
# Fractal Wave Algorithm, Charts And Systems”
#
# CI is similar to ADX where values below the 38.2 line coincides with ADX
# values above 20 which show a trending market. The author Driess preferred
# his solution over ADX.

declare lower;
input length = 14;
input UseLabels = yes;

def Hmax=highest(high, length);
def Lmin=lowest(low, length);

plot choppiness = 100* log(sum(truerange(high, close, low),length)/(Hmax-Lmin))/log(length);
choppiness.SetDefaultColor(Color.BLUE);
choppiness.SetLineWeight(1);

plot choppy=61.8;
choppy.SetDefaultColor(GetColor(2));
choppy.SetLineWeight(1);
choppy.SetStyle(Curve.POINTS);

plot trending=38.2;
trending.SetDefaultColor(GetColor(2));
trending.SetLineWeight(1);
trending.SetStyle(Curve.POINTS);

AddLabel(UseLabels && choppiness > choppy, "Consolidating, watch for break", Color.RED);
AddLabel(UseLabels && choppiness < trending, "Trending, watch for chop", Color.DARK_GREEN);

# End Study

