Good evening
@SleepyZ, I am trying to replicate the indicator in the first photo, from what I could find out the logic of the indicator is that it uses the wick theory, as a starting point I used the MTF candle script from the community that was shared in this post
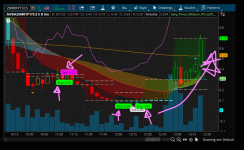
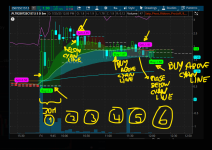
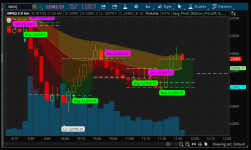
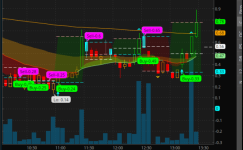
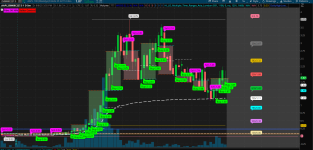
https://usethinkscript.com/threads/multi-timeframe-candles-overlay-for-thinkorswim.1425/post-153504. Then with the help of chatGPT I tried to replicate the buy and sell labels, I copied the photos they shared and, put comments on them to be able to help create the script, but I have reached a point where I can not advance further with chatGPT, since I am not a programmer I hope that with your help I can replicate the indicator. As you can see, the original indicator showed the buy label when a candle opens on or above the cyan line, then it doesn't show again, as this could mean that the price is trending. From what I've seen in the photos, it only shows the sell label until a candle closes below the cyan line (the cyan line is the opening price of the MTF candle, in this case a 30-minute candle on a 5-minute candle chart. The red line is the closing price, and the white line is 50% of the body of the previous MTF candle). I'll copy the script that I was trying to create with ChatGPT. Thank you very much in advance for your help. I would paste some other pictures showing the buy and sell labels of the indicator, maybe that could help.

script created with the help of ChatGPT
input HTF = AggregationPeriod.THIRTY_MIN;
input ShowWicks = no;
input ShowMidline = yes;
input ShowOpenLine = yes;
input ShowCloseLine = yes;
def h = high(period = HTF);
def l = low(period = HTF);
def o = open(period = HTF);
def c = close(period = HTF);
def isBullish = c >= o;
def isBearish = c < o;
def valid = !IsNaN(h) and !IsNaN(l);
# Detect start of new HTF candle when open or close changes
def newCandle = (o != o[1]) or (c != c[1]);
# Cumulative candle count increments only on new candle
rec candleCount = if newCandle then candleCount[1] + 1 else candleCount[1];
# Alternate toggle for colors based on candleCount
def altToggle = candleCount % 2 == 0;
# === WICKS (Optional) ===
AddCloud(
if ShowWicks and valid and altToggle then h else Double.NaN,
if ShowWicks and valid and altToggle then l else Double.NaN,
Color.GRAY, Color.GRAY
);
AddCloud(
if ShowWicks and valid and !altToggle then h else Double.NaN,
if ShowWicks and valid and !altToggle then l else Double.NaN,
Color.DARK_GRAY, Color.DARK_GRAY
);
# === BODY BOXES ===
AddCloud(
if valid and isBullish and altToggle then c else Double.NaN,
if valid and isBullish and altToggle then o else Double.NaN,
Color.LIGHT_GREEN, Color.LIGHT_GREEN
);
AddCloud(
if valid and isBullish and !altToggle then c else Double.NaN,
if valid and isBullish and !altToggle then o else Double.NaN,
Color.LIGHT_GREEN, Color.LIGHT_GREEN
);
AddCloud(
if valid and isBearish and altToggle then o else Double.NaN,
if valid and isBearish and altToggle then c else Double.NaN,
Color.PINK, Color.PINK
);
AddCloud(
if valid and isBearish and !altToggle then o else Double.NaN,
if valid and isBearish and !altToggle then c else Double.NaN,
Color.PINK, Color.PINK
);
# === PREVIOUS MIDLINE (Flat through NEXT HTF candle only) ===
rec prevOpen = if newCandle then o[1] else prevOpen[1];
rec prevClose = if newCandle then c[1] else prevClose[1];
rec prevMid = if newCandle then (o[1] + c[1]) / 2 else prevMid[1];
def showMid = candleCount != candleCount[1];
plot Mid = if ShowMidline and showMid then prevMid else Double.NaN;
Mid.SetDefaultColor(Color.WHITE);
Mid.SetPaintingStrategy(PaintingStrategy.DASHES);
Mid.SetLineWeight(1);
# === OPEN LINE during HTF candle ===
def showOpen = valid;
plot OpenLine = if ShowOpenLine and showOpen then o else Double.NaN;
OpenLine.SetDefaultColor(Color.CYAN);
OpenLine.SetPaintingStrategy(PaintingStrategy.DASHES);
OpenLine.SetLineWeight(1);
# === CLOSE LINE during HTF candle ===
def showClose = valid;
plot CloseLine = if ShowCloseLine and showClose then c else Double.NaN;
CloseLine.SetDefaultColor(Color.LIGHT_RED);
CloseLine.SetPaintingStrategy(PaintingStrategy.DASHES);
CloseLine.SetLineWeight(1);
# Wick Theory MTF Buy/Sell Signals - FINAL FIXED VERSION
input showBuy = yes;
input showSell = yes;
def na = Double.NaN;
# === MTF Structure ===
def htfOpen = open(period = htf);
def isNewHTF = htfOpen != htfOpen[1];
def barCount = if isNewHTF then 1 else barCount[1] + 1;
# Cyan dashed MTF open line
#plot HTFOpenLine = if !IsNaN(close) then htfOpen else na;
#HTFOpenLine.SetDefaultColor(Color.CYAN);
#HTFOpenLine.SetStyle(Curve.SHORT_DASH);
# === Candle Conditions ===
def isGreen = close > open;
def isRed = close < open;
def opensAtOrAbove = open >= htfOpen;
def closesAbove = close > htfOpen;
def closesBelow = close < htfOpen;
def validBuyBar = barCount == 1 or barCount == 5;
# === Raw Signal Conditions ===
def rawBuySignal = isGreen and opensAtOrAbove and closesAbove and validBuyBar;
def rawSellSignal = isRed and opensAtOrAbove and closesBelow;
# === Track persistent Buy state across boxes
def hasAnyBuyOccurred = if isNewHTF then rawBuySignal or hasAnyBuyOccurred[1] else hasAnyBuyOccurred[1] or rawBuySignal;
# === Buy Trigger (this box only)
def buyTriggeredThisBox = if isNewHTF then 0
else if rawBuySignal and buyTriggeredThisBox[1] == 0 then 1
else buyTriggeredThisBox[1];
# === Sell Trigger (this box only), defined after all dependencies
def sellTriggeredThisBox = if isNewHTF then 0
else if rawSellSignal and hasAnyBuyOccurred and sellTriggeredThisBox[1] == 0 then 1
else sellTriggeredThisBox[1];
# === Final Buy Plot (only if no sell has occurred in current box)
plot BuyArrow = if showBuy and rawBuySignal and buyTriggeredThisBox[1] == 0 and sellTriggeredThisBox[1] == 0
then low - TickSize() * 2 else na;
BuyArrow.SetPaintingStrategy(PaintingStrategy.ARROW_UP);
BuyArrow.SetDefaultColor(Color.GREEN);
BuyArrow.SetLineWeight(2);
AddChartBubble(
showBuy and !IsNaN(BuyArrow),
BuyArrow,
"Buy-" + AsText(close, NumberFormat.TWO_DECIMAL_PLACES),
Color.GREEN,
no
);
# === Final Sell Plot (after any prior buy across boxes)
plot SellArrow = if showSell and rawSellSignal and hasAnyBuyOccurred and sellTriggeredThisBox[1] == 0
then high + TickSize() * 2 else na;
SellArrow.SetPaintingStrategy(PaintingStrategy.ARROW_DOWN);
SellArrow.SetDefaultColor(Color.MAGENTA);
SellArrow.SetLineWeight(2);
AddChartBubble(
showSell and !IsNaN(SellArrow),
SellArrow,
"Sell-" + AsText(close, NumberFormat.TWO_DECIMAL_PLACES),
Color.MAGENTA,
yes
);