declare once_per_bar;
input Extend = {default "No", "Yes"};
def Today = GetYYYYMMDD();
def StartTime = 0930;
def Update1 = 1100;
def Update2 = 1400;
def EndTime = 1600;
# Corrected Zone time definitions using SecondsFromTime for start and SecondsTillTime for end
def IsZone1Active = SecondsFromTime(StartTime) >= 0 and SecondsTillTime(Update1) >= 0;
def IsZone2Active = SecondsFromTime(Update1) >= 0 and SecondsTillTime(Update2) >= 0;
def IsZone3Active = SecondsFromTime(Update2) >= 0 and SecondsTillTime(EndTime) >= 0;
DefineGlobalColor("Zone1", CreateColor(204, 255, 225));
DefineGlobalColor("Zone2", CreateColor(252, 220, 101));
DefineGlobalColor("Zone3", CreateColor(204, 204, 198));
### Regular Trading Hours & Aggregation Period Checks
# Define these directly. Their values will be NaN if the condition isn't met (e.g., pre-market, after-hours).
def afterStart = GetTime() > RegularTradingStart(GetYYYYMMDD());
def beforeEnd = GetTime() < RegularTradingEnd(GetYYYYMMDD());
def openPrice = DailyOpen(); # This will be the daily open price
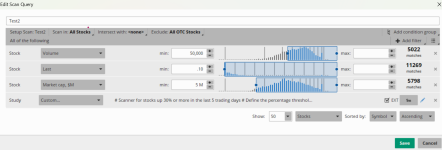
AddLabel(GetAggregationPeriod() > AggregationPeriod.FIFTEEN_MIN, "vBox Zones on 5/10/15M Charts Only", Color.RED);
script Zone {
input CountIn = 0930;
input CountOut = 1100;
def TimeFrameActive = SecondsFromTime(CountIn) >= 0 and SecondsTillTime(CountOut) >= 0;
def zoneHigh;
def zoneLow;
# Capture the high and low of the *first bar* within the active time frame,
# then persist those values for the duration of the time frame.
# We remove 'highest(volume)' as it was a syntax error and unclear in intent here.
# If you meant the high/low of the *highest volume bar* within the zone, that's more complex.
# This version captures the high/low of the first bar entering the zone.
if TimeFrameActive and !TimeFrameActive[1] {
zoneHigh = high;
zoneLow = low;
} else if TimeFrameActive {
zoneHigh = zoneHigh[1]; # Keep the value from the first bar
zoneLow = zoneLow[1]; # Keep the value from the first bar
} else {
zoneHigh = Double.NaN; # Set to NaN when not in the zone's active period
zoneLow = Double.NaN; # Set to NaN when not in the zone's active period
}
plot VZH = zoneHigh;
plot VZL = zoneLow;
VZH.Hide();
VZL.Hide();
}
### Zone Value Assignment and Extension
def Z1H_val;
def Z1L_val;
def Z2H_val;
def Z2L_val;
def Z3H_val;
def Z3L_val;
# Use CompoundValue to make the zone lines "extend" across the day if 'Extend' is "Yes".
# If 'Extend' is "No", the lines will only appear during their respective time zones.
switch (Extend) {
case "Yes":
# CompoundValue(length, visible_value, initial_value)
# We need to capture the value when it's not NaN (i.e., when the Zone script calculates it).
Z1H_val = CompoundValue(1, if !IsNaN(Zone(StartTime, Update1).VZH) then Zone(StartTime, Update1).VZH else Z1H_val[1], Double.NaN);
Z1L_val = CompoundValue(1, if !IsNaN(Zone(StartTime, Update1).VZL) then Zone(StartTime, Update1).VZL else Z1L_val[1], Double.NaN);
Z2H_val = CompoundValue(1, if !IsNaN(Zone(Update1, Update2).VZH) then Zone(Update1, Update2).VZH else Z2H_val[1], Double.NaN);
Z2L_val = CompoundValue(1, if !IsNaN(Zone(Update1, Update2).VZL) then Zone(Update1, Update2).VZL else Z2L_val[1], Double.NaN);
Z3H_val = CompoundValue(1, if !IsNaN(Zone(Update2, EndTime).VZH) then Zone(Update2, EndTime).VZH else Z3H_val[1], Double.NaN);
Z3L_val = CompoundValue(1, if !IsNaN(Zone(Update2, EndTime).VZL) then Zone(Update2, EndTime).VZL else Z3L_val[1], Double.NaN);
case "No":
# If "No" extend, we just use the direct output from the Zone script.
# The Zone script itself returns NaN outside its active period.
Z1H_val = Zone(CountIn = StartTime, CountOut = Update1).VZH;
Z1L_val = Zone(CountIn = StartTime, CountOut = Update1).VZL;
Z2H_val = Zone(CountIn = Update1, CountOut = Update2).VZH;
Z2L_val = Zone(CountIn = Update1, CountOut = Update2).VZL;
Z3H_val = Zone(CountIn = Update2, CountOut = EndTime).VZH;
Z3L_val = Zone(CountIn = Update2, CountOut = EndTime).VZL;
}
### Zone Crosses and Plotting
# Alerts based on current close relative to the zones.
# Using 'IsZoneXActive' to ensure alerts only trigger when in the respective time zone.
def BelowVZ = if IsZone1Active and close < Z1L_val or IsZone2Active and close < Z2L_val or IsZone3Active and close < Z3L_val then 1 else 0;
def AboveVZ = if IsZone1Active and close > Z1H_val or IsZone2Active and close > Z2H_val or IsZone3Active and close > Z3H_val then 1 else 0;
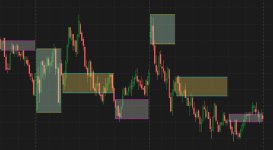
# Add clouds for the zones. The Zx_val variables already handle the NaN for plotting.
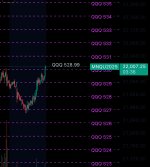
AddCloud(Z1H_val, Z1L_val, GlobalColor("Zone1"), GlobalColor("Zone1"));
AddCloud(Z2H_val, Z2L_val, GlobalColor("Zone2"), GlobalColor("Zone2"));
AddCloud(Z3H_val, Z3L_val, GlobalColor("Zone3"), GlobalColor("Zone3"));


")