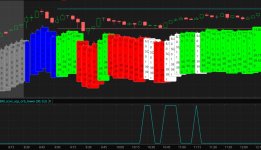
How can I include coloring candles to this version ?
# Cumulative Volume Delta
# This source code is subject to the terms of the Mozilla Public License 2.0 at https://mozilla.org/MPL/2.0/
# © Ankit_1618 converted by Zlotko

declare upper;

# Calculate upper_wick, lower_wick, spread, and body_length
def upper_wick = if close > open then high - close else high - open;
def lower_wick = if close > open then open - low else close - low;
def spread = high - low;
def body_length = spread - (upper_wick + lower_wick);

# Calculate percent_upper_wick, percent_lower_wick, and percent_body_length
def percent_upper_wick = upper_wick / spread;
def percent_lower_wick = lower_wick / spread;
def percent_body_length = body_length / spread;

# Calculate buying_volume and selling_volume
def buying_volume = if close > open then (percent_body_length + (percent_upper_wick + percent_lower_wick) / 2) * volume else ((percent_upper_wick + percent_lower_wick) / 2) * volume;
def selling_volume = if close < open then (percent_body_length + (percent_upper_wick + percent_lower_wick) / 2) * volume else ((percent_upper_wick + percent_lower_wick) / 2) * volume;

# Input for cumulation_length
input cumulation_length = 14;

# Calculate cumulative_buying_volume and cumulative_selling_volume using EMA
def cumulative_buying_volume = ExpAverage(buying_volume, cumulation_length);
def cumulative_selling_volume = ExpAverage(selling_volume, cumulation_length);

# Calculate cumulative_volume_delta
def cumulative_volume_delta = cumulative_buying_volume - cumulative_selling_volume;

# Plot histograms to represent cumulative volume delta
plot hist = cumulative_volume_delta;
hist.AssignValueColor(if cumulative_volume_delta > 0 then color.green else color.red);
hist.SetPaintingStrategy(PaintingStrategy.HISTOGRAM);
hist.SetLineWeight(1);
hist.SetDefaultColor(GetColor(1));
hist.SetStyle(Curve.FIRM);

# Calculate volume_strength_wave and plot its EMA
def volume_strength_wave = if cumulative_buying_volume > cumulative_selling_volume then cumulative_buying_volume else cumulative_selling_volume;
def ema_volume_strength_wave = ExpAverage(volume_strength_wave, cumulation_length);
#plot ema_volume_strength_wave(color = color.gray, transp = 80);
# 50%Line.SetDefaultColor(Color.GRAY);

#----Div-----------
input LookBackRight = 5; # "Pivot Lookback Right"
input LookBackLeft = 5; # "Pivot Lookback Left"
input MaxLookback = 60; # "Max of Lookback Range"
input MinLookback = 5; # "Min of Lookback Range"
input DivBull = yes; # "Plot Bullish"
input DivHiddenBull = no; # "Plot Hidden Bullish"
input DivBear = yes; # "Plot Bearish"
input DivHiddenBear = no; # "Plot Hidden Bearish"
def divSrc = cumulative_volume_delta;

def h = high;
def l = low;

script FindPivots {
input dat = close; # default data or study being evaluated
input HL = 0; # default high or low pivot designation, -1 low, +1 high
input lbL = 5; # default Pivot Lookback Left
input lbR = 1; # default Pivot Lookback Right
##############
def _nan; # used for non-number returns
def _BN; # the current barnumber
def _VStop; # confirms that the lookforward period continues the pivot trend
def _V; # the Value at the actual pivot point
##############
_BN = BarNumber();
_nan = Double.NaN;
_VStop = if !isNaN(dat) and lbr > 0 and lbl > 0 then
fold a = 1 to lbR + 1 with b=1 while b do
if HL > 0 then dat > GetValue(dat,-a) else dat < GetValue(dat,-a) else _nan;
if (HL > 0) {
_V = if _BN > lbL + 1 and dat == Highest(dat, lbL + 1) and _VStop
then dat else _nan;
} else {
_V = if _BN > lbL + 1 and dat == Lowest(dat, lbL + 1) and _VStop
then dat else _nan;
}
plot result = if !IsNaN(_V) and _VStop then _V else _nan;
}
#_inRange(cond) =>
script _inRange {
input cond = yes;
input rangeUpper = 60;
input rangeLower = 5;
def bars = if cond then 0 else bars[1] + 1;
def inrange = (rangeLower <= bars) and (bars <= rangeUpper);
plot retrun = inRange;
}
def pl = findpivots(divSrc,-1, LookBackLeft, LookBackRight);
def ph = findpivots(divSrc, 1, LookBackLeft, LookBackRight);

def plFound = if !isNaN(pl) then 1 else 0;
def phFound = if !isNaN(ph) then 1 else 0;

def vlFound1 = if plFound then divSrc else vlFound1[1];
def vlFound_ = if vlFound1==0 then divSrc[1] else vlFound1;
def vlFound = if vlFound_!=vlFound_[1] then vlFound_[1] else vlFound[1];
#valuewhen(plFound, divSrc, MinLookback, MaxLookback, 1);
def vhFound1 = if phFound then divSrc else vhFound1[1];
def vhFound_ = if vhFound1==0 then divSrc[1] else vhFound1;
def vhFound = if vhFound_!=vhFound_[1] then vhFound_[1] else vhFound[1];
#valuewhen(phFound, divSrc, MinLookback, MaxLookback, 1);
def plPrice1 = if plFound then l else plPrice1[1];
def plPrice_ = if plPrice1 == 0 then l[1] else plPrice1;
def plPrice = if plPrice_!=plPrice_[1] then plPrice_[1] else plPrice[1];
#valuewhen(plFound, l, MinLookback, MaxLookback, 1);
def phPrice1 = if phFound then h else phPrice1[1];
def phPrice_ = if phPrice1==0 then h[1] else phPrice1;
def phPrice = if phPrice_!=phPrice_[1] then phPrice_[1] else phPrice[1];
#valuewhen(phFound, h, MinLookback, MaxLookback, 1);

#// Regular Bullish
def inRangePl = _inRange(plFound[1],MaxLookback,MinLookback);
def oscHL = divSrc > vlFound and inRangePl;
def priceLL = l < plPrice;
def bullCond = DivBull and plFound and oscHL and priceLL;
#// Hidden Bullish
def oscLL = divSrc < vlFound and inRangePl;
def priceHL = l > plPrice;
def hiddenBullCond = DivHiddenBull and plFound and oscLL and priceHL;

#// Regular Bearish
def inRangePh = _inRange(phFound[1],MaxLookback,MinLookback);
def oscLH = divSrc < vhFound and inRangePh;
def priceHH = h > phPrice;
def bearCond = DivBear and phFound and oscLH and priceHH;
#// Hidden Bearish
def oscHH = divSrc > vhFound and inRangePh;
def priceLH = h < phPrice;
def hiddenBearCond = DivHiddenBear and phFound and oscHH and priceLH;

#------ Bubbles
addchartbubble(bullCond, divSrc, "R", color.GREEN, no);
addchartbubble(bearCond, divSrc, "R", CreateColor(156,39,176), yes);
addchartbubble(hiddenBullCond, divSrc, "H", color.DARK_green, no);
addchartbubble(hiddenBearCond, divSrc, "H", color.DARK_red, yes);


#----End