ChatGPT, BARD, Other AI Scripts Which Can't Be Used In ThinkOrSwim

merryDay

Administrative
Staff member
Staff
VIP
Lifetime
90% of the members attempting chatGPT scripting; do not provide good detailed specifications.

Members know what end result that they want but lack the ability to tell chatGPT, the step-by-step logic required to code a script to achieve that end result.
This results in chatGPT creating non-working garbage code.

Here is a video on how to successfully have chatGPT create functional scripts.

The above video, explains the basics of providing good specifications to AI which results in better scripts.
AOzhl05.png
 
Last edited:
ALL working hard to build a "Short squeeze indicator for the watchlist." Having a hard time coding this. Would appreciate any help.
See code below:
Code:
# === Short Squeeze Status Indicator (ORB-Style Framework) ===

def o = open;
def h = high;
def l = low;
def c = close;
def x = BarNumber();
def v = volume;

# — Float Proxy —
def liquidity = if volume > 0 then ((close * volume) / 1_000_000) else Double.NaN;
def isLowFloat = liquidity < 15;

# — Float Rotation Proxy —
def rotationScore = if liquidityProxy > 0 and (v / liquidityProxy) >= 1 then 1 else 0;

# — Momentum / Volume Filters —
def aboveVWAP = c > VWAP();
def rsiMomentum = RSI() > 60 and RSI()[1] < 40;
def volumeSurge = v > Average(v, 30) * 2;
def breakout = c > Highest(h, 10);

# — Composite Short Squeeze Score (0–5) —
def squeezeScore =
(isLowFloat ? 1 : 0) +
(rotationScore) +
(aboveVWAP ? 1 : 0) +
(rsiMomentum ? 1 : 0) +
(volumeSurge ? 1 : 0);

# — Time-Based Flag: First 30 Minutes —
def Active = GetTime() >= RegularTradingStart(GetYYYYMMDD()) and
GetTime() <= RegularTradingStart(GetYYYYMMDD()) + AggregationPeriod.Thirty_Min;

# — First 30-Min High/Low Capture —
def hh = if Active and !Active[1] then h
else if Active and h > hh[1] then h
else hh[1];

def ll = if Active and !Active[1] then l
else if Active and l < ll[1] then l
else ll[1];

# — Breakout Directional Status —
def current = if Between(c, ll, hh) then 0
else if c > hh then 1
else if c < ll then -1
else Double.NaN;

# — Label: Squeeze Score + Breakout Status —
AddLabel(1,
"Squeeze Score: " + squeezeScore + "/5 | " +
(if current == 0 then "In Range"
else if current == 1 then "Breakout ↑"
else if current == -1 then "Breakout ↓"
else "N/A"),
if squeezeScore >= 4 then Color.RED
else if squeezeScore >= 2 then Color.ORANGE
else Color.GRAY);

# — Background Color —
AssignBackgroundColor(
if squeezeScore >= 4 then CreateColor(255, 0, 0)
else if squeezeScore >= 2 then CreateColor(255, 140, 0)
else CreateColor(80, 80, 80));
 
Last edited by a moderator:

Join useThinkScript to post your question to a community of 21,000+ developers and traders.

ALL working hard to build a "Short squeeze indicator for the watchlist." Having a hard time coding this. Would appreciate any help.
See code below:
Code:
# === Short Squeeze Status Indicator (ORB-Style Framework) ===

def o = open;
def h = high;
def l = low;
def c = close;
def x = BarNumber();
def v = volume;

# — Float Proxy —
def liquidity = if volume > 0 then ((close * volume) / 1_000_000) else Double.NaN;
def isLowFloat = liquidity < 15;

# — Float Rotation Proxy —
def rotationScore = if liquidityProxy > 0 and (v / liquidityProxy) >= 1 then 1 else 0;

# — Momentum / Volume Filters —
def aboveVWAP = c > VWAP();
def rsiMomentum = RSI() > 60 and RSI()[1] < 40;
def volumeSurge = v > Average(v, 30) * 2;
def breakout = c > Highest(h, 10);

# — Composite Short Squeeze Score (0–5) —
def squeezeScore =
(isLowFloat ? 1 : 0) +
(rotationScore) +
(aboveVWAP ? 1 : 0) +
(rsiMomentum ? 1 : 0) +
(volumeSurge ? 1 : 0);

# — Time-Based Flag: First 30 Minutes —
def Active = GetTime() >= RegularTradingStart(GetYYYYMMDD()) and
GetTime() <= RegularTradingStart(GetYYYYMMDD()) + AggregationPeriod.Thirty_Min;

# — First 30-Min High/Low Capture —
def hh = if Active and !Active[1] then h
else if Active and h > hh[1] then h
else hh[1];

def ll = if Active and !Active[1] then l
else if Active and l < ll[1] then l
else ll[1];

# — Breakout Directional Status —
def current = if Between(c, ll, hh) then 0
else if c > hh then 1
else if c < ll then -1
else Double.NaN;

# — Label: Squeeze Score + Breakout Status —
AddLabel(1,
"Squeeze Score: " + squeezeScore + "/5 | " +
(if current == 0 then "In Range"
else if current == 1 then "Breakout ↑"
else if current == -1 then "Breakout ↓"
else "N/A"),
if squeezeScore >= 4 then Color.RED
else if squeezeScore >= 2 then Color.ORANGE
else Color.GRAY);

# — Background Color —
AssignBackgroundColor(
if squeezeScore >= 4 then CreateColor(255, 0, 0)
else if squeezeScore >= 2 then CreateColor(255, 140, 0)
else CreateColor(80, 80, 80));

reply to 421

next time describe what you want to see.
you told us nothing, just 'this' doesn't work


liquidityProxy doesn't exist. change it to liquidity
def rotationScore = if liquidityProxy > 0 and (v / liquidityProxy) >= 1 then 1 else 0;


fix def squeezeScore = formula
it had pinescript code


fix formula , def liquidity = . 1_000_000 isn't a number


i always start with making a chart study. then when it works, i change it into a column study.
experiment with this.
i made this into a lower study.
disable the AssignBackgroundColor( ) and add a label to show what the squeezeScore number is

Code:
#chat421_sqz_col

#JohnWick4
#7/25
#421

#ALL working hard to build a "Short squeeze indicator for the watchlist." Having a hard time coding this. Would appreciate any help.

# === Short Squeeze Status Indicator (ORB-Style Framework) ===

declare lower;

def o = open;
def h = high;
def l = low;
def c = close;
def x = BarNumber();
def v = volume;

# — Float Proxy —
def liquidity = if volume > 0 then ((close * volume) / 1000000) else Double.NaN;
def isLowFloat = liquidity < 15;

# — Float Rotation Proxy —
#def rotationScore = if liquidityProxy > 0 and (v / liquidityProxy) >= 1 then 1 else 0;
def rotationScore = if liquidity > 0 and (v / liquidity) >= 1 then 1 else 0;


# — Momentum / Volume Filters —
def aboveVWAP = c > vwap();
def rsiMomentum = RSI() > 60 and RSI()[1] < 40;
def volumeSurge = v > Average(v, 30) * 2;
def breakout = c > Highest(h, 10);

# — Composite Short Squeeze Score (0–5) —
#def squeezeScore =
#(isLowFloat ? 1 : 0) +
#(rotationScore) +
#(aboveVWAP ? 1 : 0) +
#(rsiMomentum ? 1 : 0) +
#(volumeSurge ? 1 : 0);

def squeezeScore = isLowFloat +
rotationScore +
aboveVWAP +
rsiMomentum +
volumeSurge;


# — Time-Based Flag: First 30 Minutes —
def Active = GetTime() >= RegularTradingStart(GetYYYYMMDD()) and
GetTime() <= RegularTradingStart(GetYYYYMMDD()) + AggregationPeriod.THIRTY_MIN;

# — First 30-Min High/Low Capture —
def hh = if Active and !Active[1] then h
else if Active and h > hh[1] then h
else hh[1];

def ll = if Active and !Active[1] then l
else if Active and l < ll[1] then l
else ll[1];

# — Breakout Directional Status —
def current = if Between(c, ll, hh) then 0
else if c > hh then 1
else if c < ll then -1
else Double.NaN;

# — Label: Squeeze Score + Breakout Status —
AddLabel(1,
"Squeeze Score: " + squeezeScore + "/5 | " +
(if current == 0 then "In Range"
else if current == 1 then "Breakout ↑"
else if current == -1 then "Breakout ↓"
else "N/A"),
if squeezeScore >= 4 then Color.RED
else if squeezeScore >= 2 then Color.ORANGE
else Color.GRAY);

# — Background Color —
#AssignBackgroundColor(
#if squeezeScore >= 4 then CreateColor(255, 0, 0)
#else if squeezeScore >= 2 then CreateColor(255, 140, 0)
#else CreateColor(80, 80, 80));


addlabel(1, "      " + squeezeScore + "         ",
if squeezeScore >= 4 then CreateColor(255, 0, 0)
else if squeezeScore >= 2 then CreateColor(255, 140, 0)
else CreateColor(80, 80, 80));
#
 
I've used several AI to assist with a code for a label but it keeps giving me the incorrect value. I'm trying to write a code for a label that displays the value for 5000 divided by the high of the second bar of the day plus one. It must be the second bar of the current day and it should work on all intraday time frames including custom time frames. I keep getting a code similar to the one below but none of them have worked. Any assistance would be greatly appreciated.

def newDay = GetDay() <> GetDay()[1];
def barNumber = if newDay then 1 else barNumber[1] + 1;

def secondBarHigh = if barNumber == 2 then high else secondBarHigh[1];

def isToday = GetDay() == GetLastDay();

def ratio = if isToday and !IsNaN(secondBarHigh) then 5000 / (secondBarHigh + 1) else Double.NaN;

AddLabel(isToday and !IsNaN(secondBarHigh), "5000/(2nd Bar High+1): " + Round(ratio, 2), Color.GREEN);

this calcs a number , so.... it works

saying something 'doesn't work' , is useless.
tell us what you expected and what you saw.
tell us a real world example,
.. the high of a 2nd bar
.. what stock
.. time frame


why +1? is it adding 1 at the correct place in the formula?


it is a bad idea to use variable names the same as function names. sometimes strange things happen.
barnumber is used
#https://toslc.thinkorswim.com/center/reference/thinkScript/Functions/Others/BarNumber


my version to help you debug it. , as a lower, with,
.. the count variable changed,
.. a bubble added to show values,
.. a line plotted of the 2nd bar high.

Code:
declare lower;

# label, 
# (5000 / high of the second bar of the day + 1)


def newDay = GetDay() <> GetDay()[1];
def barcnt = if newDay then 1 else barcnt[1] + 1;

def secondBarHigh = if barcnt == 2 then high else secondBarHigh[1];

def isToday = GetDay() == GetLastDay();

def ratio = if isToday and !IsNaN(secondBarHigh) then 5000 / (secondBarHigh + 1) else Double.NaN;
#def ratio = if isToday then (5000 / (secondBarHigh + 1)) else Double.NaN;

AddLabel(isToday and !IsNaN(secondBarHigh), "5000/(2nd Bar High+1): " + Round(ratio, 2), Color.GREEN);


plot z = secondBarHigh;

addchartbubble(1, low,
barcnt + "\n" +
high + "\n" +
secondBarHigh 
, color.yellow, no);
#
 
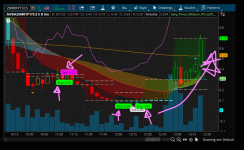
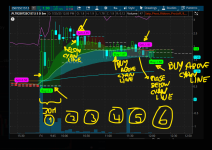
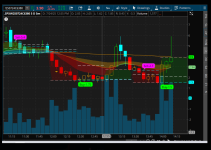
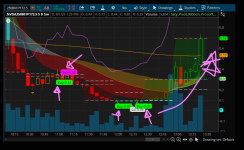
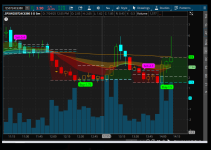
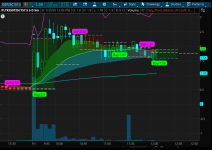
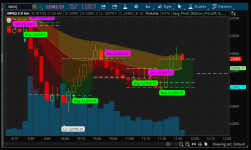
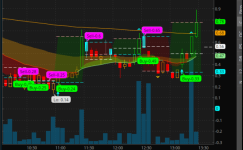
Good evening @SleepyZ, I am trying to replicate the indicator in the first photo, from what I could find out the logic of the indicator is that it uses the wick theory, as a starting point I used the MTF candle script from the community that was shared in this post https://usethinkscript.com/threads/multi-timeframe-candles-overlay-for-thinkorswim.1425/post-153504. Then with the help of chatGPT I tried to replicate the buy and sell labels, I copied the photos they shared and, put comments on them to be able to help create the script, but I have reached a point where I can not advance further with chatGPT, since I am not a programmer I hope that with your help I can replicate the indicator. As you can see, the original indicator showed the buy label when a candle opens on or above the cyan line, then it doesn't show again, as this could mean that the price is trending. From what I've seen in the photos, it only shows the sell label until a candle closes below the cyan line (the cyan line is the opening price of the MTF candle, in this case a 30-minute candle on a 5-minute candle chart. The red line is the closing price, and the white line is 50% of the body of the previous MTF candle). I'll copy the script that I was trying to create with ChatGPT. Thank you very much in advance for your help. I would paste some other pictures showing the buy and sell labels of the indicator, maybe that could help.

Screenshot 2025-08-08 141700.png


script created with the help of ChatGPT

Screenshot 2025-08-08 141949.png


input HTF = AggregationPeriod.THIRTY_MIN;
input ShowWicks = no;
input ShowMidline = yes;
input ShowOpenLine = yes;
input ShowCloseLine = yes;


def h = high(period = HTF);
def l = low(period = HTF);
def o = open(period = HTF);
def c = close(period = HTF);

def isBullish = c >= o;
def isBearish = c < o;
def valid = !IsNaN(h) and !IsNaN(l);

# Detect start of new HTF candle when open or close changes
def newCandle = (o != o[1]) or (c != c[1]);

# Cumulative candle count increments only on new candle
rec candleCount = if newCandle then candleCount[1] + 1 else candleCount[1];

# Alternate toggle for colors based on candleCount
def altToggle = candleCount % 2 == 0;

# === WICKS (Optional) ===
AddCloud(
if ShowWicks and valid and altToggle then h else Double.NaN,
if ShowWicks and valid and altToggle then l else Double.NaN,
Color.GRAY, Color.GRAY
);
AddCloud(
if ShowWicks and valid and !altToggle then h else Double.NaN,
if ShowWicks and valid and !altToggle then l else Double.NaN,
Color.DARK_GRAY, Color.DARK_GRAY
);

# === BODY BOXES ===
AddCloud(
if valid and isBullish and altToggle then c else Double.NaN,
if valid and isBullish and altToggle then o else Double.NaN,
Color.LIGHT_GREEN, Color.LIGHT_GREEN
);
AddCloud(
if valid and isBullish and !altToggle then c else Double.NaN,
if valid and isBullish and !altToggle then o else Double.NaN,
Color.LIGHT_GREEN, Color.LIGHT_GREEN
);
AddCloud(
if valid and isBearish and altToggle then o else Double.NaN,
if valid and isBearish and altToggle then c else Double.NaN,
Color.PINK, Color.PINK
);
AddCloud(
if valid and isBearish and !altToggle then o else Double.NaN,
if valid and isBearish and !altToggle then c else Double.NaN,
Color.PINK, Color.PINK
);

# === PREVIOUS MIDLINE (Flat through NEXT HTF candle only) ===
rec prevOpen = if newCandle then o[1] else prevOpen[1];
rec prevClose = if newCandle then c[1] else prevClose[1];
rec prevMid = if newCandle then (o[1] + c[1]) / 2 else prevMid[1];
def showMid = candleCount != candleCount[1];

plot Mid = if ShowMidline and showMid then prevMid else Double.NaN;
Mid.SetDefaultColor(Color.WHITE);
Mid.SetPaintingStrategy(PaintingStrategy.DASHES);
Mid.SetLineWeight(1);

# === OPEN LINE during HTF candle ===
def showOpen = valid;
plot OpenLine = if ShowOpenLine and showOpen then o else Double.NaN;
OpenLine.SetDefaultColor(Color.CYAN);
OpenLine.SetPaintingStrategy(PaintingStrategy.DASHES);
OpenLine.SetLineWeight(1);

# === CLOSE LINE during HTF candle ===
def showClose = valid;
plot CloseLine = if ShowCloseLine and showClose then c else Double.NaN;
CloseLine.SetDefaultColor(Color.LIGHT_RED);
CloseLine.SetPaintingStrategy(PaintingStrategy.DASHES);
CloseLine.SetLineWeight(1);

# Wick Theory MTF Buy/Sell Signals - FINAL FIXED VERSION

input showBuy = yes;
input showSell = yes;

def na = Double.NaN;

# === MTF Structure ===
def htfOpen = open(period = htf);
def isNewHTF = htfOpen != htfOpen[1];
def barCount = if isNewHTF then 1 else barCount[1] + 1;

# Cyan dashed MTF open line
#plot HTFOpenLine = if !IsNaN(close) then htfOpen else na;
#HTFOpenLine.SetDefaultColor(Color.CYAN);
#HTFOpenLine.SetStyle(Curve.SHORT_DASH);

# === Candle Conditions ===
def isGreen = close > open;
def isRed = close < open;
def opensAtOrAbove = open >= htfOpen;
def closesAbove = close > htfOpen;
def closesBelow = close < htfOpen;
def validBuyBar = barCount == 1 or barCount == 5;

# === Raw Signal Conditions ===
def rawBuySignal = isGreen and opensAtOrAbove and closesAbove and validBuyBar;
def rawSellSignal = isRed and opensAtOrAbove and closesBelow;

# === Track persistent Buy state across boxes
def hasAnyBuyOccurred = if isNewHTF then rawBuySignal or hasAnyBuyOccurred[1] else hasAnyBuyOccurred[1] or rawBuySignal;

# === Buy Trigger (this box only)
def buyTriggeredThisBox = if isNewHTF then 0
else if rawBuySignal and buyTriggeredThisBox[1] == 0 then 1
else buyTriggeredThisBox[1];

# === Sell Trigger (this box only), defined after all dependencies
def sellTriggeredThisBox = if isNewHTF then 0
else if rawSellSignal and hasAnyBuyOccurred and sellTriggeredThisBox[1] == 0 then 1
else sellTriggeredThisBox[1];

# === Final Buy Plot (only if no sell has occurred in current box)
plot BuyArrow = if showBuy and rawBuySignal and buyTriggeredThisBox[1] == 0 and sellTriggeredThisBox[1] == 0
then low - TickSize() * 2 else na;
BuyArrow.SetPaintingStrategy(PaintingStrategy.ARROW_UP);
BuyArrow.SetDefaultColor(Color.GREEN);
BuyArrow.SetLineWeight(2);

AddChartBubble(
showBuy and !IsNaN(BuyArrow),
BuyArrow,
"Buy-" + AsText(close, NumberFormat.TWO_DECIMAL_PLACES),
Color.GREEN,
no
);

# === Final Sell Plot (after any prior buy across boxes)
plot SellArrow = if showSell and rawSellSignal and hasAnyBuyOccurred and sellTriggeredThisBox[1] == 0
then high + TickSize() * 2 else na;
SellArrow.SetPaintingStrategy(PaintingStrategy.ARROW_DOWN);
SellArrow.SetDefaultColor(Color.MAGENTA);
SellArrow.SetLineWeight(2);

AddChartBubble(
showSell and !IsNaN(SellArrow),
SellArrow,
"Sell-" + AsText(close, NumberFormat.TWO_DECIMAL_PLACES),
Color.MAGENTA,
yes
);
 

Attachments

  • Screenshot 2025-08-04 222153.png
    Screenshot 2025-08-04 222153.png
    84 KB · Views: 107
  • Screenshot 2025-08-04 214636.png
    Screenshot 2025-08-04 214636.png
    114.2 KB · Views: 99
  • Screenshot 2025-08-04 211527.png
    Screenshot 2025-08-04 211527.png
    63.5 KB · Views: 97
  • Screenshot 2025-08-04 222153.png
    Screenshot 2025-08-04 222153.png
    84 KB · Views: 91
  • Screenshot 2025-08-04 211527.png
    Screenshot 2025-08-04 211527.png
    63.5 KB · Views: 87
  • Screenshot 2025-08-04 211436.png
    Screenshot 2025-08-04 211436.png
    54.4 KB · Views: 89
  • Screenshot 2025-08-04 210803.png
    Screenshot 2025-08-04 210803.png
    61.6 KB · Views: 93
  • Screenshot 2025-08-01 234553.png
    Screenshot 2025-08-01 234553.png
    286.2 KB · Views: 89
  • Screenshot 2025-08-10 224327.png
    Screenshot 2025-08-10 224327.png
    128.5 KB · Views: 86
Last edited:
I am working on this code to draw horizontal lines across the chart. the text that I have in bold is where thinkorswim yells at me. it doesn't like the code in regards to the color. How can I fix?

TIA

Rich (BB code):
#
# Key Levels Indicator - FINAL VERIFIED CODE WITH VARIABLE COLORS
# Displays horizontal lines for today's O/H/L, yesterday's H/L/C, and the weekly Open.
#

declare upper;

# --- INPUTS (These colors are VARIABLE and editable in the study settings) ---

input showTodayOHL = yes;
input showYesterdayHLC = yes;
input showWeeklyOpen = yes;

# The {default Color.X} syntax makes the color input VARIABLE.
input todayColor = {default Color.Yellow};
input yesterdayColor = {default Color.CYAN};
input weeklyColor = {default Color.MAGENTA};
input lineStyle = Curve.LONG_DASH;

# --- DAILY AGGREGATION (TODAY & YESTERDAY) ---

# Get today's key levels (O/H/L)
def todayOpen = open(period = AggregationPeriod.DAY);
def todayHigh = high(period = AggregationPeriod.DAY);
def todayLow = low(period = AggregationPeriod.DAY);

# Get yesterday's key levels (H/L/C)
def yesterdayHigh = high(period = AggregationPeriod.DAY)[1];
def yesterdayLow = low(period = AggregationPeriod.DAY)[1];
def yesterdayClose = close(period = AggregationPeriod.DAY)[1];

# --- WEEKLY AGGREGATION ---

# Get the weekly Open
def weeklyOpen = open(period = AggregationPeriod.WEEK);

# --- PLOTS (TODAY'S LEVELS) ---

plot TodayO = if showTodayOHL then todayOpen else Double.NaN;
TodayO.SetDefaultColor(todayColor);
TodayO.SetStyle(lineStyle);
TodayO.SetLineWeight(2);
TodayO.HideBubble();
AddLabel(showTodayOHL, "Today Open: " + AsDollars(todayOpen), todayColor);

plot TodayH = if showTodayOHL then todayHigh else Double.NaN;
TodayH.SetDefaultColor(todayColor);
TodayH.SetStyle(lineStyle);
TodayH.SetLineWeight(2);
TodayH.HideBubble();
AddLabel(showTodayOHL, "Today High: " + AsDollars(todayHigh), todayColor);

plot TodayL = if showTodayOHL then todayLow else Double.NaN;
TodayL.SetDefaultColor(todayColor);
TodayL.SetStyle(lineStyle);
TodayL.SetLineWeight(2);
TodayL.HideBubble();
AddLabel(showTodayOHL, "Today Low: " + AsDollars(todayLow), todayColor);


# --- PLOTS (YESTERDAY'S LEVELS) ---

plot YesterdayH = if showYesterdayHLC then yesterdayHigh else Double.NaN;
YesterdayH.SetDefaultColor(yesterdayColor);
YesterdayH.SetStyle(lineStyle);
YesterdayH.SetLineWeight(2);
YesterdayH.HideBubble();
AddLabel(showYesterdayHLC, "Yest High: " + AsDollars(yesterdayHigh), yesterdayColor);

plot YesterdayL = if showYesterdayHLC then yesterdayLow else Double.NaN;
YesterdayL.SetDefaultColor(yesterdayColor);
YesterdayL.SetStyle(lineStyle);
YesterdayL.SetLineWeight(2);
YesterdayL.HideBubble();
AddLabel(showYesterdayHLC, "Yest Low: " + AsDollars(yesterdayLow), yesterdayColor);

plot YesterdayC = if showYesterdayHLC then yesterdayClose else Double.NaN;
YesterdayC.SetDefaultColor(yesterdayColor);
YesterdayC.SetStyle(Curve.FIRM);
YesterdayC.SetLineWeight(3);
YesterdayC.HideBubble();
AddLabel(showYesterdayHLC, "Yest Close: " + AsDollars(yesterdayClose), yesterdayColor);


# --- PLOTS (WEEKLY LEVEL) ---

plot WeeklyO = if showWeeklyOpen then weeklyOpen else Double.NaN;
WeeklyO.SetDefaultColor(weeklyColor);
WeeklyO.SetStyle(Curve.FIRM);
WeeklyO.SetLineWeight(4);
WeeklyO.HideBubble();
AddLabel(showWeeklyOpen, "Weekly Open: " + AsDollars(weeklyOpen), weeklyColor);
 
Last edited by a moderator:
@ladyfibonacci Unfortunately you have to define every color you wish to use, and changing color from an input is bulky and awkward from a coding standpoint. I don't usually bother with inputs for color so someone else may have a cleaner solution.

Here it is with the 3 colors you had listed as defaults.
Untitled.png


Ruby:
#
# Key Levels Indicator - FINAL VERIFIED CODE WITH VARIABLE COLORS
# Displays horizontal lines for today's O/H/L, yesterday's H/L/C, and the weekly Open.
#

declare upper;

# --- INPUTS (These colors are VARIABLE and editable in the study settings) ---

input showTodayOHL = yes;
input showYesterdayHLC = yes;
input showWeeklyOpen = yes;

# The {default Color.X} syntax makes the color input VARIABLE.
input todayColor = {default YELLOW, CYAN, MAGENTA};
input yesterdayColor = {default CYAN, MAGENTA, YELLOW};
input weeklyColor = {default MAGENTA, YELLOW, CYAN};
input lineStyle = Curve.LONG_DASH;

DefineGlobalColor("Yellow", Color.YELLOW);
DefineGlobalColor("Cyan", Color.CYAN);
DefineGlobalColor("Magenta", Color.MAGENTA);

# --- DAILY AGGREGATION (TODAY & YESTERDAY) ---

# Get today's key levels (O/H/L)
def todayOpen = open(period = AggregationPeriod.DAY);
def todayHigh = high(period = AggregationPeriod.DAY);
def todayLow = low(period = AggregationPeriod.DAY);

# Get yesterday's key levels (H/L/C)
def yesterdayHigh = high(period = AggregationPeriod.DAY)[1];
def yesterdayLow = low(period = AggregationPeriod.DAY)[1];
def yesterdayClose = close(period = AggregationPeriod.DAY)[1];

# --- WEEKLY AGGREGATION ---

# Get the weekly Open
def weeklyOpen = open(period = AggregationPeriod.WEEK);

# --- PLOTS (TODAY'S LEVELS) ---

plot TodayO;
switch (todayColor) {
case YELLOW:
    TodayO = if showTodayOHL then todayOpen else Double.NaN;
case CYAN:
    TodayO = if showTodayOHL then todayOpen else Double.NaN;
default:
    TodayO = if showTodayOHL then todayOpen else Double.NaN;
}
TodayO.AssignValueColor(
if todayColor == todayColor."Cyan" then GlobalColor("Cyan") else
if todayColor == todayColor."Magenta" then GlobalColor("Magenta") else
GlobalColor("Yellow"));
TodayO.SetStyle(lineStyle);
TodayO.SetLineWeight(2);
TodayO.HideBubble();
AddLabel(showTodayOHL, "Today Open: " + AsDollars(todayOpen), if todayColor == todayColor."Cyan" then GlobalColor("Cyan") else
if todayColor == todayColor."Magenta" then GlobalColor("Magenta") else GlobalColor("Yellow"));

plot TodayH;
switch (todayColor) {
case YELLOW:
    TodayH = if showTodayOHL then todayHigh else Double.NaN;
case CYAN:
    TodayH = if showTodayOHL then todayHigh else Double.NaN;
default:
    TodayH = if showTodayOHL then todayHigh else Double.NaN;
}
TodayH.AssignValueColor(
if todayColor == todayColor."Cyan" then GlobalColor("Cyan") else
if todayColor == todayColor."Magenta" then GlobalColor("Magenta") else
GlobalColor("Yellow"));
TodayH.SetStyle(lineStyle);
TodayH.SetLineWeight(2);
TodayH.HideBubble();

AddLabel(showTodayOHL, "Today High: " + AsDollars(todayHigh), if todayColor == todayColor."Cyan" then
GlobalColor("Cyan") else if todayColor == todayColor."Magenta" then GlobalColor("Magenta") else GlobalColor("Yellow"));

plot TodayL;
switch (todayColor) {
case YELLOW:
    TodayL = if showTodayOHL then todayLow else Double.NaN;
case CYAN:
    TodayL = if showTodayOHL then todayLow else Double.NaN;
default:
    TodayL = if showTodayOHL then todayLow else Double.NaN;
}
TodayL.AssignValueColor(
if todayColor == todayColor."Cyan" then GlobalColor("Cyan") else
if todayColor == todayColor."Magenta" then GlobalColor("Magenta") else
GlobalColor("Yellow"));
TodayL.SetStyle(lineStyle);
TodayL.SetLineWeight(2);
TodayL.HideBubble();

AddLabel(showTodayOHL, "Today Low: " + AsDollars(todayLow), if todayColor == todayColor."Cyan" then
GlobalColor("Cyan") else if todayColor == todayColor."Magenta" then GlobalColor("Magenta") else GlobalColor("Yellow"));


# --- PLOTS (YESTERDAY'S LEVELS) ---

plot YesterdayH;
switch (yesterdayColor) {
case MAGENTA:
    YesterdayH = if showYesterdayHLC then yesterdayHigh else Double.NaN;
case YELLOW:
    YesterdayH = if showYesterdayHLC then yesterdayHigh else Double.NaN;
default:
    YesterdayH = if showYesterdayHLC then yesterdayHigh else Double.NaN;
}
YesterdayH.AssignValueColor(
if yesterdayColor == yesterdayColor."Magenta" then GlobalColor("Magenta") else
if yesterdayColor == yesterdayColor."Yellow" then GlobalColor("Yellow") else
GlobalColor("Cyan"));
YesterdayH.SetStyle(lineStyle);
YesterdayH.SetLineWeight(2);
YesterdayH.HideBubble();

AddLabel(showYesterdayHLC, "Yest High: " + AsDollars(yesterdayHigh), if yesterdayColor == yesterdayColor."Magenta" then GlobalColor("Magenta") else if yesterdayColor == yesterdayColor."Yellow" then GlobalColor("Yellow") else
GlobalColor("Cyan"));

plot YesterdayL;
switch (yesterdayColor) {
case MAGENTA:
    YesterdayL = if showYesterdayHLC then yesterdayLow else Double.NaN;
case YELLOW:
    YesterdayL = if showYesterdayHLC then yesterdayLow else Double.NaN;
default:
    YesterdayL = if showYesterdayHLC then yesterdayLow else Double.NaN;
}
YesterdayL.AssignValueColor(
if yesterdayColor == yesterdayColor."Magenta" then GlobalColor("Magenta") else
if yesterdayColor == yesterdayColor."Yellow" then GlobalColor("Yellow") else
GlobalColor("Cyan"));
YesterdayL.SetStyle(lineStyle);
YesterdayL.SetLineWeight(2);
YesterdayL.HideBubble();

AddLabel(showYesterdayHLC, "Yest Low: " + AsDollars(yesterdayLow), if yesterdayColor == yesterdayColor."Magenta" then GlobalColor("Magenta") else if yesterdayColor == yesterdayColor."Yellow" then GlobalColor("Yellow") else
GlobalColor("Cyan"));

plot YesterdayC;
switch (yesterdayColor) {
case MAGENTA:
    YesterdayC = if showYesterdayHLC then yesterdayClose else Double.NaN;
case YELLOW:
    YesterdayC = if showYesterdayHLC then yesterdayClose else Double.NaN;
default:
    YesterdayC = if showYesterdayHLC then yesterdayClose else Double.NaN;
}
YesterdayC.AssignValueColor(
if yesterdayColor == yesterdayColor."Magenta" then GlobalColor("Magenta") else
if yesterdayColor == yesterdayColor."Yellow" then GlobalColor("Yellow") else
GlobalColor("Cyan"));
YesterdayC.SetStyle(Curve.FIRM);
YesterdayC.SetLineWeight(3);
YesterdayC.HideBubble();

AddLabel(showYesterdayHLC, "Yest Close: " + AsDollars(yesterdayClose), if yesterdayColor == yesterdayColor."Magenta" then GlobalColor("Magenta") else if yesterdayColor == yesterdayColor."Yellow" then GlobalColor("Yellow") else
GlobalColor("Cyan"));


# --- PLOTS (WEEKLY LEVEL) ---

plot WeeklyO;
switch (weeklyColor) {
case YELLOW:
    WeeklyO = if showWeeklyOpen then weeklyOpen else Double.NaN;
case CYAN:
    WeeklyO = if showWeeklyOpen then weeklyOpen else Double.NaN;
default:
    WeeklyO = if showWeeklyOpen then weeklyOpen else Double.NaN;
}
WeeklyO.AssignValueColor(
if weeklyColor == weeklyColor."Yellow" then GlobalColor("Yellow") else
if weeklyColor == weeklyColor."Cyan" then GlobalColor("Cyan") else
GlobalColor("Magenta"));
WeeklyO.SetStyle(Curve.FIRM);
WeeklyO.SetLineWeight(4);
WeeklyO.HideBubble();

AddLabel(showWeeklyOpen, "Weekly Open: " + AsDollars(weeklyOpen), if weeklyColor == weeklyColor."Yellow" then GlobalColor("Yellow") else if weeklyColor == weeklyColor."Cyan" then GlobalColor("Cyan") else
GlobalColor("Magenta"));
 
I am working on this code to draw horizontal lines across the chart. the text that I have in bold is where thinkorswim yells at me. it doesn't like the code in regards to the color. How can I fix?

TIA

Rich (BB code):
#
# Key Levels Indicator - FINAL VERIFIED CODE WITH VARIABLE COLORS
# Displays horizontal lines for today's O/H/L, yesterday's H/L/C, and the weekly Open.
#

declare upper;

# --- INPUTS (These colors are VARIABLE and editable in the study settings) ---

input showTodayOHL = yes;
input showYesterdayHLC = yes;
input showWeeklyOpen = yes;

# The {default Color.X} syntax makes the color input VARIABLE.
input todayColor = {default Color.Yellow};
input yesterdayColor = {default Color.CYAN};
input weeklyColor = {default Color.MAGENTA};
input lineStyle = Curve.LONG_DASH;

# --- DAILY AGGREGATION (TODAY & YESTERDAY) ---

# Get today's key levels (O/H/L)
def todayOpen = open(period = AggregationPeriod.DAY);
def todayHigh = high(period = AggregationPeriod.DAY);
def todayLow = low(period = AggregationPeriod.DAY);

# Get yesterday's key levels (H/L/C)
def yesterdayHigh = high(period = AggregationPeriod.DAY)[1];
def yesterdayLow = low(period = AggregationPeriod.DAY)[1];
def yesterdayClose = close(period = AggregationPeriod.DAY)[1];

# --- WEEKLY AGGREGATION ---

# Get the weekly Open
def weeklyOpen = open(period = AggregationPeriod.WEEK);

# --- PLOTS (TODAY'S LEVELS) ---

plot TodayO = if showTodayOHL then todayOpen else Double.NaN;
TodayO.SetDefaultColor(todayColor);
TodayO.SetStyle(lineStyle);
TodayO.SetLineWeight(2);
TodayO.HideBubble();
AddLabel(showTodayOHL, "Today Open: " + AsDollars(todayOpen), todayColor);

plot TodayH = if showTodayOHL then todayHigh else Double.NaN;
TodayH.SetDefaultColor(todayColor);
TodayH.SetStyle(lineStyle);
TodayH.SetLineWeight(2);
TodayH.HideBubble();
AddLabel(showTodayOHL, "Today High: " + AsDollars(todayHigh), todayColor);

plot TodayL = if showTodayOHL then todayLow else Double.NaN;
TodayL.SetDefaultColor(todayColor);
TodayL.SetStyle(lineStyle);
TodayL.SetLineWeight(2);
TodayL.HideBubble();
AddLabel(showTodayOHL, "Today Low: " + AsDollars(todayLow), todayColor);


# --- PLOTS (YESTERDAY'S LEVELS) ---

plot YesterdayH = if showYesterdayHLC then yesterdayHigh else Double.NaN;
YesterdayH.SetDefaultColor(yesterdayColor);
YesterdayH.SetStyle(lineStyle);
YesterdayH.SetLineWeight(2);
YesterdayH.HideBubble();
AddLabel(showYesterdayHLC, "Yest High: " + AsDollars(yesterdayHigh), yesterdayColor);

plot YesterdayL = if showYesterdayHLC then yesterdayLow else Double.NaN;
YesterdayL.SetDefaultColor(yesterdayColor);
YesterdayL.SetStyle(lineStyle);
YesterdayL.SetLineWeight(2);
YesterdayL.HideBubble();
AddLabel(showYesterdayHLC, "Yest Low: " + AsDollars(yesterdayLow), yesterdayColor);

plot YesterdayC = if showYesterdayHLC then yesterdayClose else Double.NaN;
YesterdayC.SetDefaultColor(yesterdayColor);
YesterdayC.SetStyle(Curve.FIRM);
YesterdayC.SetLineWeight(3);
YesterdayC.HideBubble();
AddLabel(showYesterdayHLC, "Yest Close: " + AsDollars(yesterdayClose), yesterdayColor);


# --- PLOTS (WEEKLY LEVEL) ---

plot WeeklyO = if showWeeklyOpen then weeklyOpen else Double.NaN;
WeeklyO.SetDefaultColor(weeklyColor);
WeeklyO.SetStyle(Curve.FIRM);
WeeklyO.SetLineWeight(4);
WeeklyO.HideBubble();
AddLabel(showWeeklyOpen, "Weekly Open: " + AsDollars(weeklyOpen), weeklyColor);

reply to 426

this code allows user to pick a color. it uses getcolor()
read the comments. the color words have no affect on chosen color. which ever one in the sequence is chosen, is converted to an index number.
https://usethinkscript.com/threads/format-watchlist-text-in-thinkorswim.4045/page-3#post-67014
 
NEWBIE ALERT, any comments / corrections / instructions are appreciated

First attempt at creating any form of study or strategy on TOS.

Unsure why I am NOT getting the indicators

What I am "trying" to achieve
  • Use the 15-min Opening Range for context (captures the first auction).
  • Trade on the 2-min chart for finer entry/management — better entries, tighter stops.
  • Require VWAP + volume + ADX + index bias to reduce false breakouts.
  • Use ATR-based stops/targets and a trailing ATR stop for volatility-adaptive exits.
  • Use partial initial size + add-on on retest/continuation to improve expectancy and reduce early whipsaw losses.

Code:
# Expert_ORB_15m_on_2m_Strategy
# CREATE: 15-min Opening Range (9:30-9:45) used as context; trade & manage on 2-min chart.
# Features: VWAP gate, volume spike, ADX trend filter, partial entry + add-on on retest,
# ATR stops, ATR targets, trailing ATR stop, time-of-day gate.
# Vivid colors used (no GREEN / RED).

input OR_StartTime = 0930;
input OR_EndTime = 0945; # Opening Range window (HHMM)
input onlyTradeAfterOR = yes;

# Filters
input useVWAPFilter = yes;
input requirePriceAboveVWAPForLongs = yes; # longs require > vwap, shorts require < vwap
input useVolumeFilter = yes;
input avgVolLength = 20;
input volumeMultiplier = 1.5;
input useADXFilter = yes;
input adxLength = 14;
input adxThreshold = 18;

# Entry / sizing
input baseShares = 10;
input addOnShares = 10; # second tranche for add-on
input maxTradesPerDay = 3;

# Stops & Targets
input atrLength = 14;
input entryStopATR = 1.5; # initial stop distance in ATR
input profitTargetATR = 2.5; # initial profit target in ATR
input useTrailing = yes;
input trailingATRMultiplier = 1.0; # trailing stop = peak - ATR*multiplier
input trailingUpdateBars = 1; # update trailing each bar

# Retest / add-on behavior
input allowRetestAdd = yes;
input retestWindowBars = 12; # how many 2-min bars after breakout we allow retest to add
input retestPctFromOR = 0.005; # allow pullback up to this % below ORHigh for long add (0.005 = 0.5%)

# Time gating
input tradeStartTime = 0946; # start accepting signals (1 min after OR end recommended)
input tradeEndTime = 1500; # stop new entries after this time (HHMM)
input maxTradeDurationMinutes = 60; # max minutes to keep a trade if neither target nor stop hit

# ---------- visuals (use direct Color constants) ----------
# (avoiding green & red)
# Color choices: CYAN, MAGENTA, ORANGE, YELLOW, PINK, BLUE
# Use these directly in plotting and AddOrder calls below.

# --------------------------
# SESSION / OR detection
def secondsFromOpen = SecondsFromTime(OR_StartTime);
def secondsTillORend = SecondsTillTime(OR_EndTime);
def inORWindow = secondsFromOpen >= 0 and secondsTillORend > 0;

# capture OR high/low during window (persist after window closes)
rec ORHighRec = if inORWindow and GetDay() <> GetDay()[1] then high
else if inORWindow then Max(ORHighRec[1], high)
else if GetDay() <> GetDay()[1] then Double.NaN
else ORHighRec[1];
rec ORLowRec = if inORWindow and GetDay() <> GetDay()[1] then low
else if inORWindow then Min(ORLowRec[1], low)
else if GetDay() <> GetDay()[1] then Double.NaN
else ORLowRec[1];

plot ORHigh = ORHighRec;
plot ORLow = ORLowRec;
ORHigh.SetDefaultColor(Color.BLUE);
ORLow.SetDefaultColor(Color.BLUE);
ORHigh.SetLineWeight(2);
ORLow.SetLineWeight(2);

# VWAP (intraday)
plot vwap = reference VWAP();
vwap.SetDefaultColor(Color.DARK_GREEN);

# Volume filter
def avgVol = Average(volume, avgVolLength);
def volSpike = volume > volumeMultiplier * avgVol;

# ADX
def adx = ADX(adxLength);

# ATR (on the trading timeframe - expect you will use 2-min)
def TR = TrueRange(high, close, low);
def ATR = Average(TR, atrLength);

# After OR is complete?
def afterOR = !inORWindow and !IsNaN(ORHigh) and !IsNaN(ORLow);

# Time-of-day gating for entries
def canTradeTime = SecondsFromTime(tradeStartTime) >= 0 and SecondsTillTime(tradeEndTime) > 0;

# Entry conditions (2-min closes)
def brokeLong = close > ORHigh and close[1] <= ORHigh[1];
def brokeShort = close < ORLow and close[1] >= ORLow[1];

# Combined confirmation filters
def passVWAPLong = !useVWAPFilter or (requirePriceAboveVWAPForLongs and close > vwap) or (!requirePriceAboveVWAPForLongs and close < vwap);
def passVWAPShort = !useVWAPFilter or (requirePriceAboveVWAPForLongs and close < vwap) or (!requirePriceAboveVWAPForLongs and close > vwap);

def passVol = !useVolumeFilter or volSpike;
def passADX = !useADXFilter or adx > adxThreshold;

def allowNewEntries = !onlyTradeAfterOR or afterOR;
def timeOK = canTradeTime;

def longSignal = allowNewEntries and timeOK and afterOR and brokeLong and passVWAPLong and passVol and passADX;
def shortSignal = allowNewEntries and timeOK and afterOR and brokeShort and passVWAPShort and passVol and passADX;

# Prevent more than N trades per day (count entries) - simple rec tracker
rec tradesToday = if GetDay() <> GetDay()[1] then 0
else if longSignal or shortSignal then tradesToday[1] + 1
else tradesToday[1];
def allowTradeCount = tradesToday < maxTradesPerDay;

# Finalized entry signals with trade count gating
def finalLongEntry = longSignal and allowTradeCount;
def finalShortEntry = shortSignal and allowTradeCount;

# Record entry bar & price for management (rec variables)
rec entryBarLong = if finalLongEntry then BarNumber() else entryBarLong[1];
rec entryPriceLong = if finalLongEntry then close else entryPriceLong[1];

rec entryBarShort = if finalShortEntry then BarNumber() else entryBarShort[1];
rec entryPriceShort = if finalShortEntry then close else entryPriceShort[1];

# Initial stop & target computed at entry (persist)
rec longInitStop = if finalLongEntry then close - ATR * entryStopATR else longInitStop[1];
rec longInitTarget = if finalLongEntry then close + ATR * profitTargetATR else longInitTarget[1];

rec shortInitStop = if finalShortEntry then close + ATR * entryStopATR else shortInitStop[1];
rec shortInitTarget = if finalShortEntry then close - ATR * profitTargetATR else shortInitTarget[1];

# Trailing stop state (update only if already in trade)
rec longTrail = if finalLongEntry then entryPriceLong - ATR * trailingATRMultiplier
else if useTrailing and !IsNaN(longTrail[1]) and close - ATR * trailingATRMultiplier > longTrail[1] then close - ATR * trailingATRMultiplier
else longTrail[1];

rec shortTrail = if finalShortEntry then entryPriceShort + ATR * trailingATRMultiplier
else if useTrailing and !IsNaN(shortTrail[1]) and close + ATR * trailingATRMultiplier < shortTrail[1] then close + ATR * trailingATRMultiplier
else shortTrail[1];

# Age based exit (maxTradeDurationMinutes) -- convert minutes -> # of 2-min bars
def barsAllowed = Max(1, maxTradeDurationMinutes / 2);
def longAgeExit = !IsNaN(entryBarLong) and (BarNumber() - entryBarLong) >= barsAllowed;
def shortAgeExit = !IsNaN(entryBarShort) and (BarNumber() - entryBarShort) >= barsAllowed;

# Retest add-on logic (look for pullback to ORHigh within retestWindowBars after breakout)
rec barsSinceLastBreakLong = if brokeLong then 0 else if !IsNaN(barsSinceLastBreakLong[1]) then barsSinceLastBreakLong[1] + 1 else 9999;
def retestLongCondition = allowRetestAdd and !IsNaN(ORHigh) and barsSinceLastBreakLong <= retestWindowBars and close <= ORHigh * (1 + retestPctFromOR) and close >= ORHigh * (1 - retestPctFromOR);

rec barsSinceLastBreakShort = if brokeShort then 0 else if !IsNaN(barsSinceLastBreakShort[1]) then barsSinceLastBreakShort[1] + 1 else 9999;
def retestShortCondition = allowRetestAdd and !IsNaN(ORLow) and barsSinceLastBreakShort <= retestWindowBars and close >= ORLow * (1 - retestPctFromOR) and close <= ORLow * (1 + retestPctFromOR);

# Exits: check intrabar high/low crossing
def longHitTarget = !IsNaN(longInitTarget) and high >= longInitTarget;
def longHitStop = !IsNaN(longInitStop) and low <= longInitStop;
def longHitTrail = useTrailing and !IsNaN(longTrail) and low <= longTrail;
def shortHitTarget = !IsNaN(shortInitTarget) and low <= shortInitTarget;
def shortHitStop = !IsNaN(shortInitStop) and high >= shortInitStop;
def shortHitTrail = useTrailing and !IsNaN(shortTrail) and high >= shortTrail;

# Combine exit signals
def exitLongNow = longHitTarget or longHitStop or longHitTrail or longAgeExit;
def exitShortNow = shortHitTarget or shortHitStop or shortHitTrail or shortAgeExit;

# ---------- AddOrders ----------
# Long entry (base)
AddOrder(OrderType.BUY_TO_OPEN, finalLongEntry, open[-1], baseShares, Color.CYAN, Color.CYAN, name = "ORB Long Entry");

# Long add-on (on retest while still within allowed windows)
AddOrder(OrderType.BUY_TO_OPEN, retestLongCondition and allowTradeCount and !finalLongEntry and !IsNaN(ORHigh), open[-1], addOnShares, Color.CYAN, Color.CYAN, name = "ORB Long Add");

# Long exit (close all)
AddOrder(OrderType.SELL_TO_CLOSE, exitLongNow and !IsNaN(entryPriceLong), close, baseShares + addOnShares, Color.YELLOW, Color.ORANGE, name = "Close Long All");

# Short entry (base)
AddOrder(OrderType.SELL_TO_OPEN, finalShortEntry, open[-1], baseShares, Color.MAGENTA, Color.MAGENTA, name = "ORB Short Entry");

# Short add-on
AddOrder(OrderType.SELL_TO_OPEN, retestShortCondition and allowTradeCount and !finalShortEntry and !IsNaN(ORLow), open[-1], addOnShares, Color.MAGENTA, Color.MAGENTA, name = "ORB Short Add");

# Short exit
AddOrder(OrderType.BUY_TO_CLOSE, exitShortNow and !IsNaN(entryPriceShort), open[-1], baseShares + addOnShares, Color.YELLOW, Color.ORANGE, name = "Close Short All");

# ---------- Visual plots for stops / targets / trail ----------
plot pLongStop = if !IsNaN(longInitStop) then longInitStop else Double.NaN;
plot pLongTarget = if !IsNaN(longInitTarget) then longInitTarget else Double.NaN;
plot pLongTrail = if !IsNaN(longTrail) then longTrail else Double.NaN;
plot pShortStop = if !IsNaN(shortInitStop) then shortInitStop else Double.NaN;
plot pShortTarget = if !IsNaN(shortInitTarget) then shortInitTarget else Double.NaN;
plot pShortTrail = if !IsNaN(shortTrail) then shortTrail else Double.NaN;

pLongStop.SetDefaultColor(Color.ORANGE);
pLongTarget.SetDefaultColor(Color.YELLOW);
pLongTrail.SetDefaultColor(Color.PINK);
pShortStop.SetDefaultColor(Color.ORANGE);
pShortTarget.SetDefaultColor(Color.YELLOW);
pShortTrail.SetDefaultColor(Color.PINK);

# Bubbles for entries
AddChartBubble(finalLongEntry, low - ATR * 0.3, "ORB Long ►", Color.CYAN, no);
AddChartBubble(finalShortEntry, high + ATR * 0.3, "ORB Short ▼", Color.MAGENTA, yes);

# End of strategy
 
Last edited by a moderator:
NEWBIE ALERT, any comments / corrections / instructions are appreciated

First attempt at creating any form of study or strategy on TOS.

Unsure why I am NOT getting the indicators

What I am "trying" to achieve
  • Use the 15-min Opening Range for context (captures the first auction).
  • Trade on the 2-min chart for finer entry/management — better entries, tighter stops.
  • Require VWAP + volume + ADX + index bias to reduce false breakouts.
  • Use ATR-based stops/targets and a trailing ATR stop for volatility-adaptive exits.
  • Use partial initial size + add-on on retest/continuation to improve expectancy and reduce early whipsaw losses.

It is a robust script and can be a greater than 55% win rate, but I just don't play in that time frame very much to help you out sorry - too busy for me. I tried a few things but I did not see anything that would be outstanding, but again I do not trade in this timeframe - I don't even look at it lol, sorry. I even tried it as a 2 minute strategy and it faired ok in back testing.
1761516441605.png

https://tos.mx/!vgbAvPGj
Code:
# Expert_ORB_15m_on_2m_Strategy v2.0
# 15-min Opening Range (9:30–9:45) on 2-min chart
# Features: VWAP, Volume, ADX, Retest Add-On, ATR Stops/Targets/Trailing, Time Gates
# Enhanced with: Fixed breakout logic, OR Midline, Win Rate Label, TF Assertion
# Vivid colors (no GREEN/RED) — CYAN, MAGENTA, ORANGE, YELLOW, PINK, BLUE
#Made into a strategy by antwerks 10/26/2025
#declare lower;

# ================================
# INPUTS
# ================================

input OR_StartTime = 0930;
input OR_EndTime = 0945;
input onlyTradeAfterOR = yes;

# Filters
input useVWAPFilter = yes;
input useVolumeFilter = yes;
input avgVolLength = 20;
input volumeMultiplier = 1.5;
input useADXFilter = yes;
input adxLength = 14;
input adxThreshold = 18;

# Entry / Sizing
input baseShares = 10;
input addOnShares = 10;
input maxTradesPerDay = 3;

# Stops & Targets
input atrLength = 14;
input entryStopATR = 1.5;
input profitTargetATR = 2.5;
input useTrailing = yes;
input trailingATRMultiplier = 1.0;
input trailingUpdateBars = 1;

# Retest / Add-on
input allowRetestAdd = yes;
input retestWindowBars = 12;
input retestPctFromOR = 0.005;  # 0.5%

# Time Gating
input tradeStartTime = 0946;
input tradeEndTime = 1500;
input maxTradeDurationMinutes = 60;

# ================================
# ASSERTIONS & VALIDATION
# ================================

Assert(GetAggregationPeriod() == AggregationPeriod.TWO_MIN, "ERROR: This strategy requires a 2-minute chart.");

# ================================
# OPENING RANGE (15-min)
# ================================

def secondsFromOpen = SecondsFromTime(OR_StartTime);
def secondsTillORend = SecondsTillTime(OR_EndTime);
def inORWindow = secondsFromOpen >= 0 and secondsTillORend > 0;

rec ORHighRec = if inORWindow and GetDay() != GetDay()[1] then high
                else if inORWindow then Max(ORHighRec[1], high)
                else ORHighRec[1];

rec ORLowRec = if inORWindow and GetDay() != GetDay()[1] then low
               else if inORWindow then Min(ORLowRec[1], low)
               else ORLowRec[1];

plot ORHigh = ORHighRec;
plot ORLow = ORLowRec;
plot ORMid = if !IsNaN(ORHigh) and !IsNaN(ORLow) then (ORHigh + ORLow) / 2 else Double.NaN;

ORHigh.SetDefaultColor(Color.BLUE);
ORLow.SetDefaultColor(Color.BLUE);
ORMid.SetDefaultColor(Color.GRAY);
ORHigh.SetLineWeight(2);
ORLow.SetLineWeight(2);
ORMid.SetLineWeight(1);
ORMid.SetStyle(Curve.SHORT_DASH);

# ================================
# INDICATORS
# ================================

plot vwap = reference VWAP();
vwap.SetDefaultColor(Color.DARK_GREEN);

def avgVol = Average(volume, avgVolLength);
def volSpike = volume > volumeMultiplier * avgVol;

def adx = ADX(adxLength);

def TR = TrueRange(high, close, low);
def ATR = Average(TR, atrLength);

# ================================
# STATE LOGIC
# ================================

def afterOR = !inORWindow and !IsNaN(ORHigh) and !IsNaN(ORLow);
def canTradeTime = SecondsFromTime(tradeStartTime) >= 0 and SecondsTillTime(tradeEndTime) > 0;

# ================================
# BREAKOUT DETECTION (FIXED)
# ================================

def brokeLong = close > ORHigh and close[1] <= ORHigh;  # Fixed: uses current ORHigh
def brokeShort = close < ORLow and close[1] >= ORLow;

# ================================
# FILTERS (SIMPLIFIED & CLEAR)
# ================================

def passVWAPLong = !useVWAPFilter or close > vwap;
def passVWAPShort = !useVWAPFilter or close < vwap;
def passVol = !useVolumeFilter or volSpike;
def passADX = !useADXFilter or adx > adxThreshold;

def allowNewEntries = !onlyTradeAfterOR or afterOR;
def timeOK = canTradeTime;

# ================================
# ENTRY SIGNALS
# ================================

def longSignal = allowNewEntries and timeOK and afterOR and brokeLong and passVWAPLong and passVol and passADX;
def shortSignal = allowNewEntries and timeOK and afterOR and brokeShort and passVWAPShort and passVol and passADX;

# Trade counter
rec tradesToday = if GetDay() != GetDay()[1] then 0
                  else if longSignal or shortSignal then tradesToday[1] + 1
                  else tradesToday[1];

def allowTradeCount = tradesToday < maxTradesPerDay;

def finalLongEntry = longSignal and allowTradeCount;
def finalShortEntry = shortSignal and allowTradeCount;

# ================================
# RETEST ADD-ON LOGIC
# ================================

rec barsSinceBreakLong = if brokeLong then 0 else barsSinceBreakLong[1] + 1;
rec barsSinceBreakShort = if brokeShort then 0 else barsSinceBreakShort[1] + 1;

def retestLongCondition = allowRetestAdd and barsSinceBreakLong <= retestWindowBars
                          and close <= ORHigh * (1 + retestPctFromOR)
                          and close >= ORHigh * (1 - retestPctFromOR)
                          and !finalLongEntry and allowTradeCount;

def retestShortCondition = allowRetestAdd and barsSinceBreakShort <= retestWindowBars
                           and close >= ORLow * (1 - retestPctFromOR)
                           and close <= ORLow * (1 + retestPctFromOR)
                           and !finalShortEntry and allowTradeCount;

# ================================
# POSITION TRACKING
# ================================

rec entryBarLong = if finalLongEntry then BarNumber() else entryBarLong[1];
rec entryPriceLong = if finalLongEntry then close else entryPriceLong[1];
rec entryBarShort = if finalShortEntry then BarNumber() else entryBarShort[1];
rec entryPriceShort = if finalShortEntry then close else entryPriceShort[1];

rec longInitStop = if finalLongEntry then close - ATR * entryStopATR else longInitStop[1];
rec longInitTarget = if finalLongEntry then close + ATR * profitTargetATR else longInitTarget[1];
rec shortInitStop = if finalShortEntry then close + ATR * entryStopATR else shortInitStop[1];
rec shortInitTarget = if finalShortEntry then close - ATR * profitTargetATR else shortInitTarget[1];

# Trailing Stop
rec longTrail = if finalLongEntry then close - ATR * trailingATRMultiplier
                else if useTrailing and !IsNaN(longTrail[1]) and close - ATR * trailingATRMultiplier > longTrail[1]
                then close - ATR * trailingATRMultiplier
                else longTrail[1];

rec shortTrail = if finalShortEntry then close + ATR * trailingATRMultiplier
                 else if useTrailing and !IsNaN(shortTrail[1]) and close + ATR * trailingATRMultiplier < shortTrail[1]
                 then close + ATR * trailingATRMultiplier
                 else shortTrail[1];

# Max Duration Exit
def barsAllowed = Max(1, Round(maxTradeDurationMinutes / 2, 0));
def longAgeExit = !IsNaN(entryBarLong) and (BarNumber() - entryBarLong) >= barsAllowed;
def shortAgeExit = !IsNaN(entryBarShort) and (BarNumber() - entryBarShort) >= barsAllowed;

# ================================
# EXIT CONDITIONS
# ================================

def longHitTarget = !IsNaN(longInitTarget) and high >= longInitTarget;
def longHitStop = !IsNaN(longInitStop) and low <= longInitStop;
def longHitTrail = useTrailing and !IsNaN(longTrail) and low <= longTrail;

def shortHitTarget = !IsNaN(shortInitTarget) and low <= shortInitTarget;
def shortHitStop = !IsNaN(shortInitStop) and high >= shortInitStop;
def shortHitTrail = useTrailing and !IsNaN(shortTrail) and high >= shortTrail;

def exitLongNow = longHitTarget or longHitStop or longHitTrail or longAgeExit;
def exitShortNow = shortHitTarget or shortHitStop or shortHitTrail or shortAgeExit;

# ================================
# PERFORMANCE TRACKING
# ================================

rec totalTrades = if GetDay() != GetDay()[1] then 0
                  else if finalLongEntry or finalShortEntry then totalTrades[1] + 1
                  else totalTrades[1];

rec winningTrades = if GetDay() != GetDay()[1] then 0
                    else if exitLongNow and high >= longInitTarget then winningTrades[1] + 1
                    else if exitShortNow and low <= shortInitTarget then winningTrades[1] + 1
                    else winningTrades[1];

def winRate = if totalTrades > 0 then Round(100 * winningTrades / totalTrades, 1) else 0;

AddLabel(yes, "Win Rate: " + winRate + "% (" + winningTrades + "/" + totalTrades + ")", Color.CYAN);
AddLabel(yes, "ADX: " + Round(adx, 1), if adx > adxThreshold then Color.CYAN else Color.GRAY);
AddLabel(yes, "ATR: " + Round(ATR, 2), Color.YELLOW);

# ================================
# ORDERS
# ================================

AddOrder(OrderType.BUY_TO_OPEN, finalLongEntry, open[-1], baseShares, Color.CYAN, Color.CYAN, "ORB Long");
AddOrder(OrderType.BUY_TO_OPEN, retestLongCondition, open[-1], addOnShares, Color.CYAN, Color.CYAN, "ORB Long Add");

AddOrder(OrderType.SELL_TO_CLOSE, exitLongNow && !IsNaN(entryPriceLong), close, baseShares + addOnShares, Color.YELLOW, Color.ORANGE, "Close Long");

AddOrder(OrderType.SELL_TO_OPEN, finalShortEntry, open[-1], baseShares, Color.MAGENTA, Color.MAGENTA, "ORB Short");
AddOrder(OrderType.SELL_TO_OPEN, retestShortCondition, open[-1], addOnShares, Color.MAGENTA, Color.MAGENTA, "ORB Short Add");

AddOrder(OrderType.BUY_TO_CLOSE, exitShortNow && !IsNaN(entryPriceShort), open[-1], baseShares + addOnShares, Color.YELLOW, Color.ORANGE, "Close Short");

# ================================
# VISUALS
# ================================

plot pLongStop = if !IsNaN(longInitStop) then longInitStop else Double.NaN;
plot pLongTarget = if !IsNaN(longInitTarget) then longInitTarget else Double.NaN;
plot pLongTrail = if !IsNaN(longTrail) then longTrail else Double.NaN;
plot pShortStop = if !IsNaN(shortInitStop) then shortInitStop else Double.NaN;
plot pShortTarget = if !IsNaN(shortInitTarget) then shortInitTarget else Double.NaN;
plot pShortTrail = if !IsNaN(shortTrail) then shortTrail else Double.NaN;

pLongStop.SetDefaultColor(Color.ORANGE);
pLongTarget.SetDefaultColor(Color.YELLOW);
pLongTrail.SetDefaultColor(Color.PINK);
pShortStop.SetDefaultColor(Color.ORANGE);
pShortTarget.SetDefaultColor(Color.YELLOW);
pShortTrail.SetDefaultColor(Color.PINK);

# Entry Bubbles
AddChartBubble(finalLongEntry, low - ATR * 0.3, "LONG", Color.CYAN, no);
AddChartBubble(finalShortEntry, high + ATR * 0.3, "SHORT", Color.MAGENTA, yes);
AddChartBubble(retestLongCondition, low - ATR * 0.3, "ADD", Color.CYAN, no);
AddChartBubble(retestShortCondition, high + ATR * 0.3, "ADD", Color.MAGENTA, yes);

# End of Strategy
 

Similar threads

Not the exact question you're looking for?

Start a new thread and receive assistance from our community.

87k+ Posts
543 Online
Create Post

Similar threads

Similar threads

The Market Trading Game Changer

Join 2,500+ subscribers inside the useThinkScript VIP Membership Club
  • Exclusive indicators
  • Proven strategies & setups
  • Private Discord community
  • ‘Buy The Dip’ signal alerts
  • Exclusive members-only content
  • Add-ons and resources
  • 1 full year of unlimited support

Frequently Asked Questions

What is useThinkScript?

useThinkScript is the #1 community of stock market investors using indicators and other tools to power their trading strategies. Traders of all skill levels use our forums to learn about scripting and indicators, help each other, and discover new ways to gain an edge in the markets.

How do I get started?

We get it. Our forum can be intimidating, if not overwhelming. With thousands of topics, tens of thousands of posts, our community has created an incredibly deep knowledge base for stock traders. No one can ever exhaust every resource provided on our site.

If you are new, or just looking for guidance, here are some helpful links to get you started.

What are the benefits of VIP Membership?
VIP members get exclusive access to these proven and tested premium indicators: Buy the Dip, Advanced Market Moves 2.0, Take Profit, and Volatility Trading Range. In addition, VIP members get access to over 50 VIP-only custom indicators, add-ons, and strategies, private VIP-only forums, private Discord channel to discuss trades and strategies in real-time, customer support, trade alerts, and much more. Learn all about VIP membership here.
How can I access the premium indicators?
To access the premium indicators, which are plug and play ready, sign up for VIP membership here.
Back
Top