The author states:
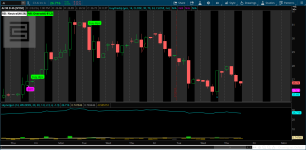
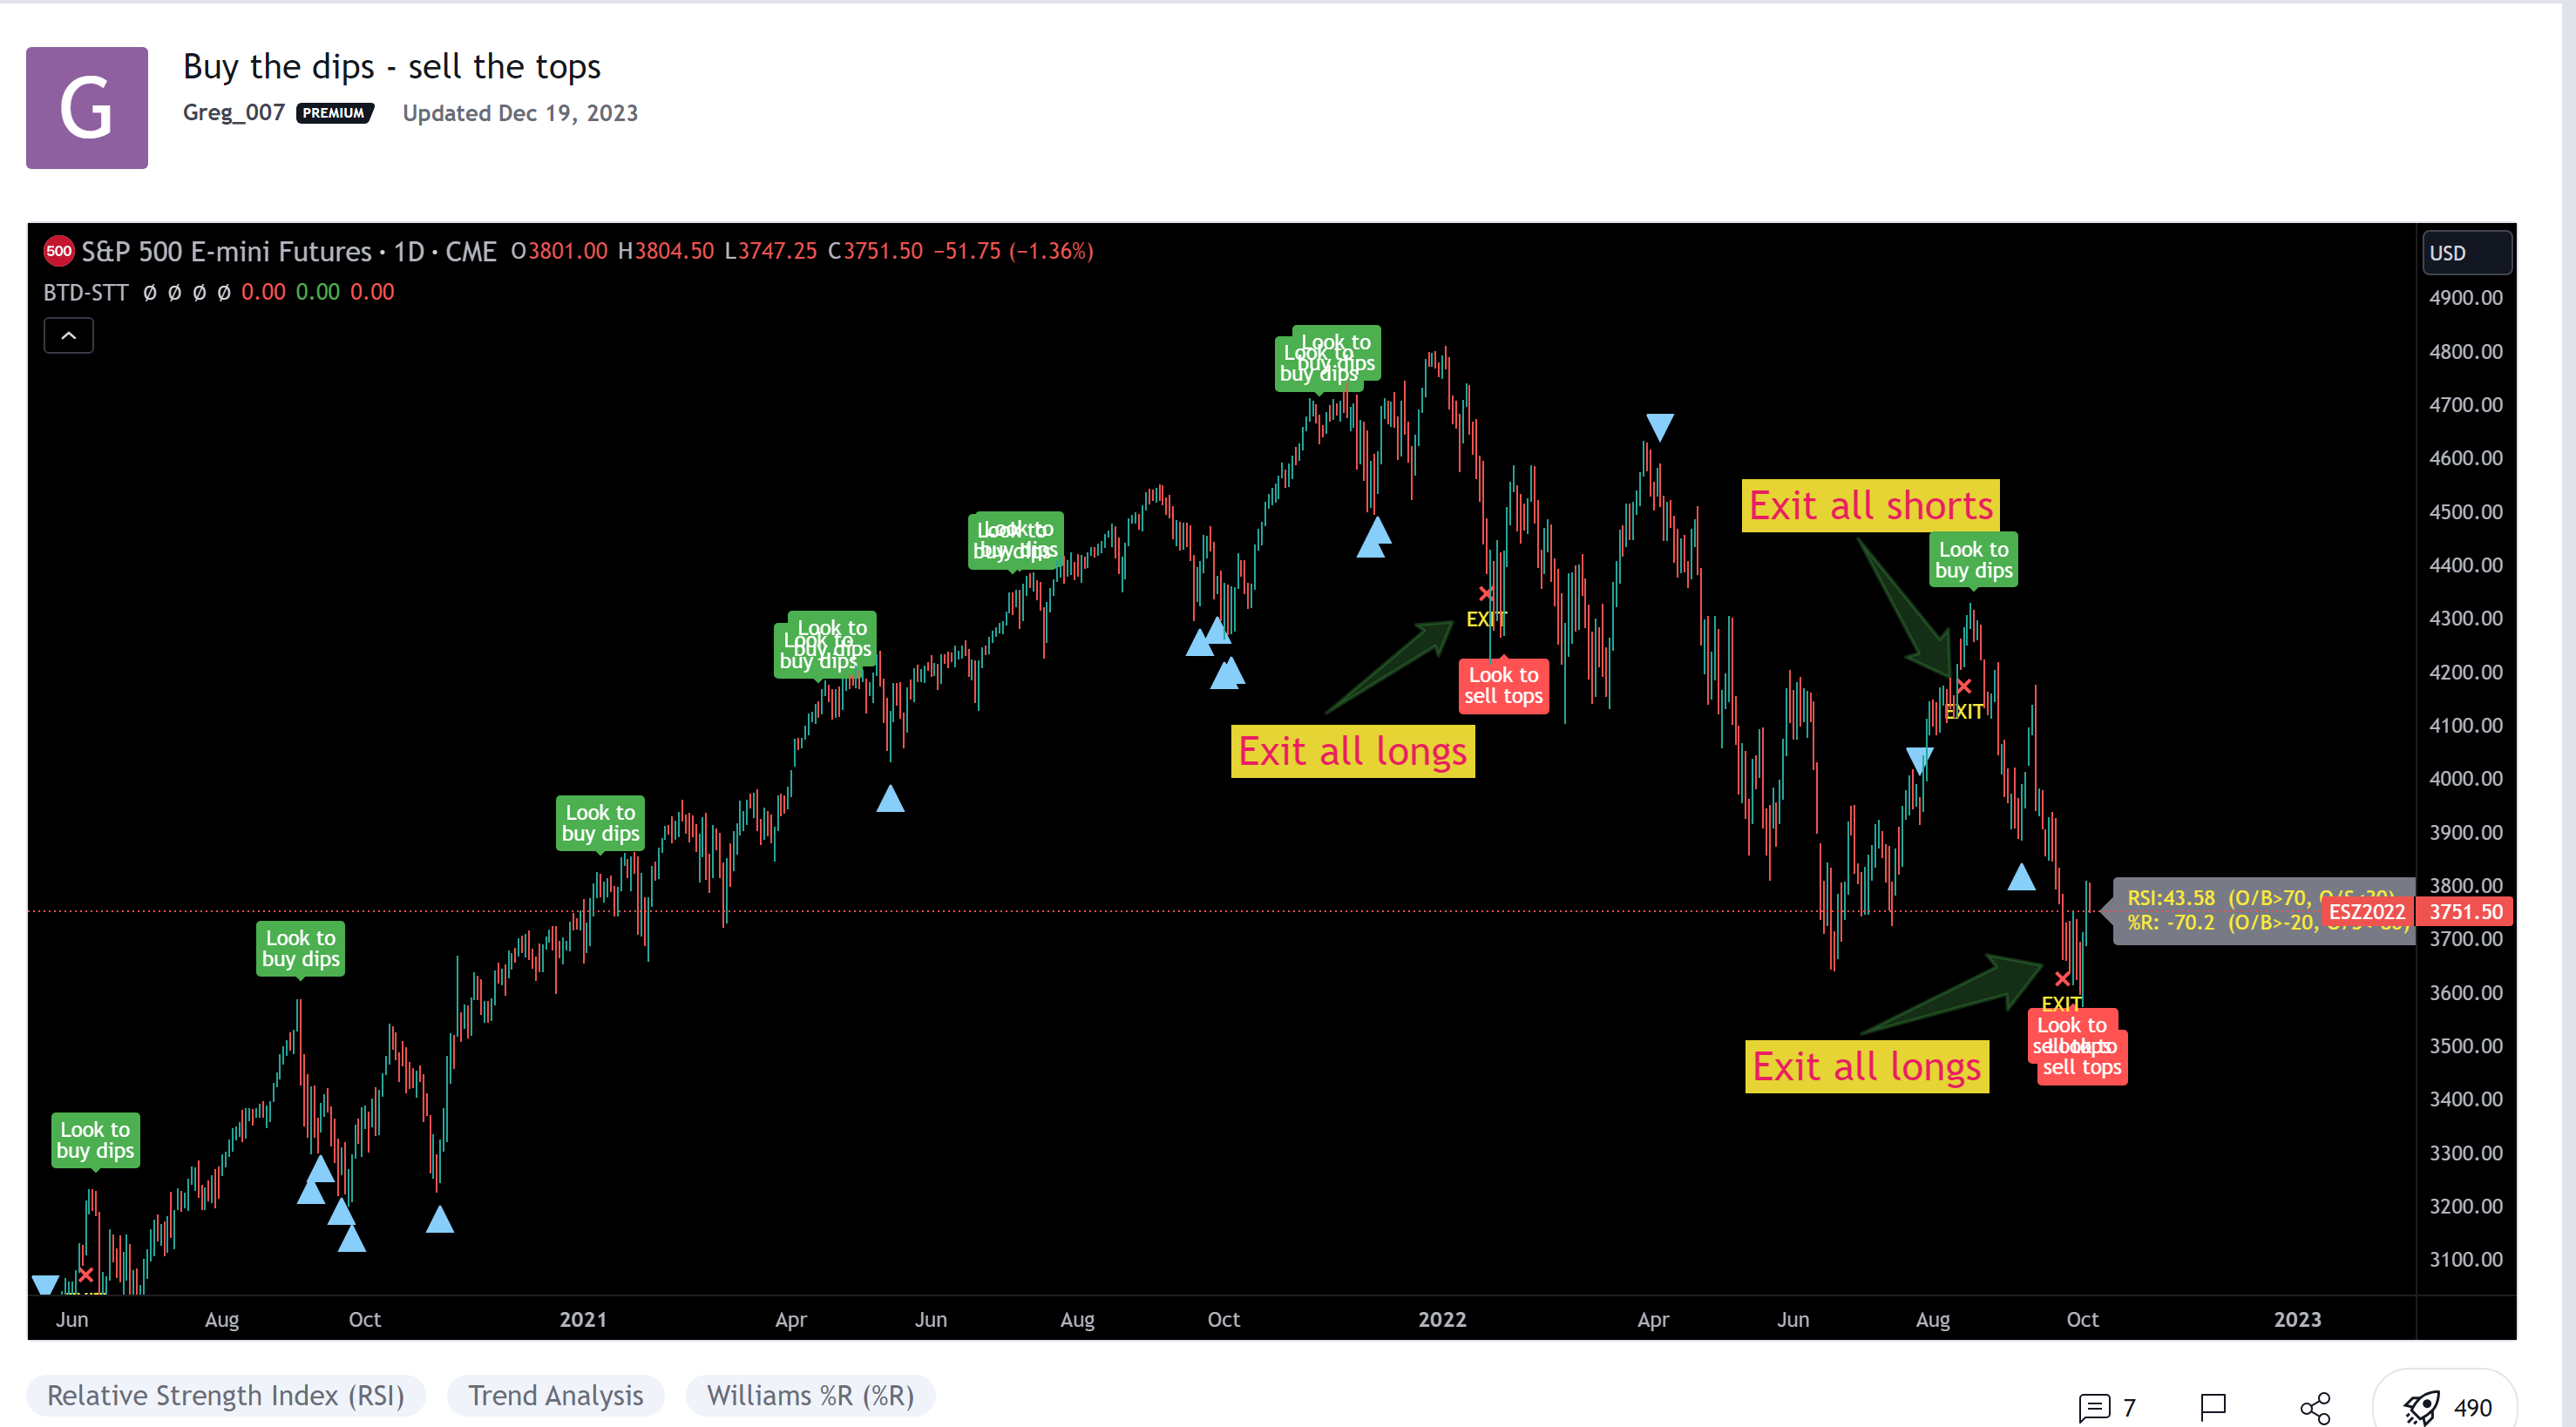
This script is a merge of the RSI and the Williams %R.
I've observed that in strong uptrends, we go from RSI overbought to RSI overbought, but it hardly gets oversold. (the same in the opposite direction)
To find a better entry point, Williams %R is used to find oversold conditions in an uptrend or overbought in a downtrend.
=> When W%R returns from oversold/overbought to normal, a triangle will be plotted and this is the point of entry to add to your position. (there's an option to mark all candles in the overbought/oversold region, by default it is off)
=> When RSI goes from overbought back to normal it will tell you to buy the dip. In a downtrend it will tell you to sell the tops.
=> When the RSI gets oversold and the previous RSI was overbought, it will mark to exit the position
Trading it this way is not the best idea ;-) 2 Interesting observations however:
please convert:
https://www.tradingview.com/v/snhADyBo/
This script is a merge of the RSI and the Williams %R.
I've observed that in strong uptrends, we go from RSI overbought to RSI overbought, but it hardly gets oversold. (the same in the opposite direction)
To find a better entry point, Williams %R is used to find oversold conditions in an uptrend or overbought in a downtrend.
=> When W%R returns from oversold/overbought to normal, a triangle will be plotted and this is the point of entry to add to your position. (there's an option to mark all candles in the overbought/oversold region, by default it is off)
=> When RSI goes from overbought back to normal it will tell you to buy the dip. In a downtrend it will tell you to sell the tops.
=> When the RSI gets oversold and the previous RSI was overbought, it will mark to exit the position
Trading it this way is not the best idea ;-) 2 Interesting observations however:
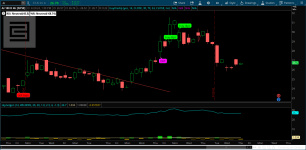
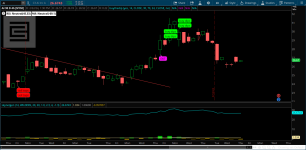
- Once you get the entry right, in 80% of the cases, you do reach the next RSI oversold/overbought level. Keeping your position open until you reach that level can be an option to maximize profits.
- When a triangle is plotted and it is the low compared to the previous more or less 5 candles (same for the high), chances are high it will be taken out a few candles later, so don't take a trade yet.
please convert:
https://www.tradingview.com/v/snhADyBo/
Last edited by a moderator: