The author states:
The "Multi-Divergence Buy/Sell Indicator" is a technical analysis tool that combines multiple divergence signals from different indicators to identify potential buy and sell opportunities in the market. Here's a breakdown of how the indicator works and how to use it:
Input Parameters:
RSI Length: Specifies the length of the RSI (Relative Strength Index) calculation.
MACD Short Length: Specifies the short-term length for the MACD (Moving Average Convergence Divergence) calculation.
MACD Long Length: Specifies the long-term length for the MACD calculation.
MACD Signal Smoothing: Specifies the smoothing length for the MACD signal line calculation.
Stochastic Length: Specifies the length of the Stochastic oscillator calculation.
Stochastic Overbought Level: Defines the overbought level for the Stochastic oscillator.
Stochastic Oversold Level: Defines the oversold level for the Stochastic oscillator.
Calculation of Indicators:
RSI: Calculates the RSI based on the specified RSI Length.
MACD: Calculates the MACD line, signal line, and histogram based on the specified MACD parameters.
Stochastic: Calculates the Stochastic oscillator based on the specified Stochastic parameters.
Divergence Detection:
RSI Divergence: Identifies a bullish divergence when the RSI crosses above its 14-period simple moving average (SMA).
MACD Divergence: Identifies a bullish divergence when the MACD line crosses above the signal line.
Stochastic Divergence: Identifies a bullish divergence when the Stochastic crosses above its 14-period SMA.
Buy and Sell Conditions:
Buy Condition: Triggers a buy signal when all three divergences (RSI, MACD, and Stochastic) occur simultaneously.
Sell Condition: Triggers a sell signal when both RSI and MACD divergences occur, but Stochastic divergence does not occur.
Plotting Buy/Sell Signals:
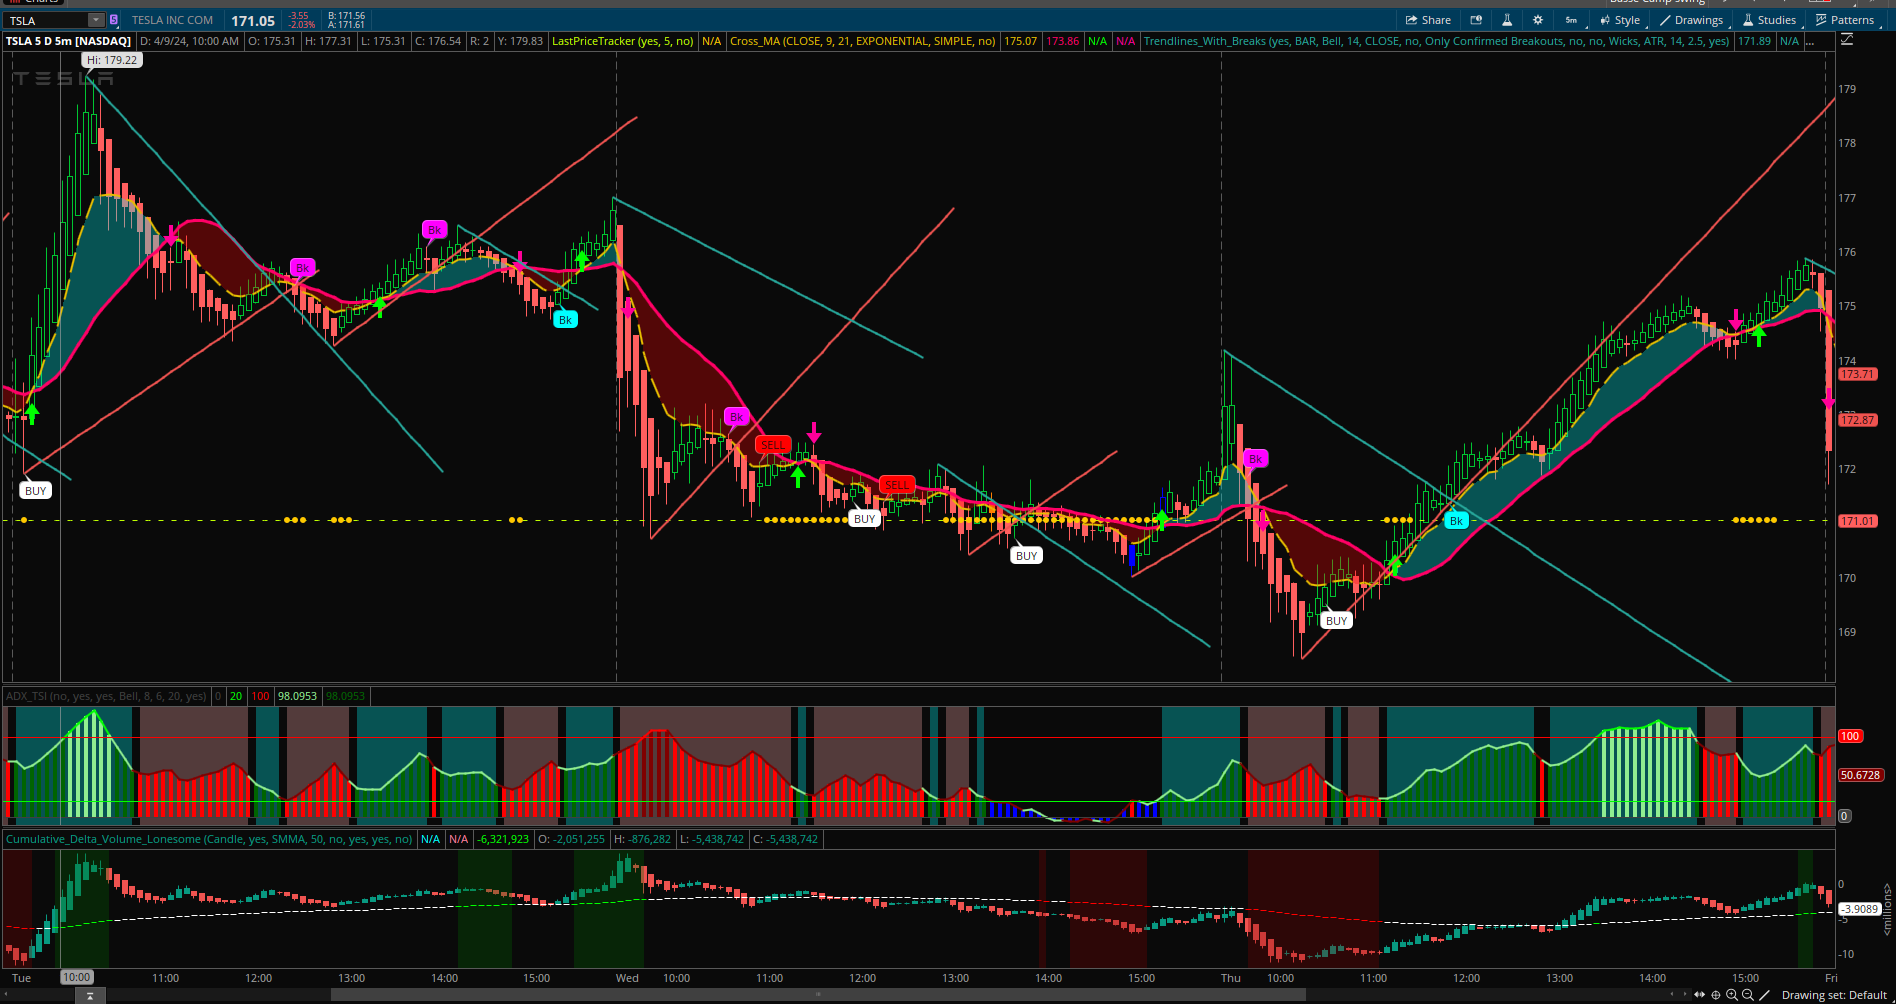
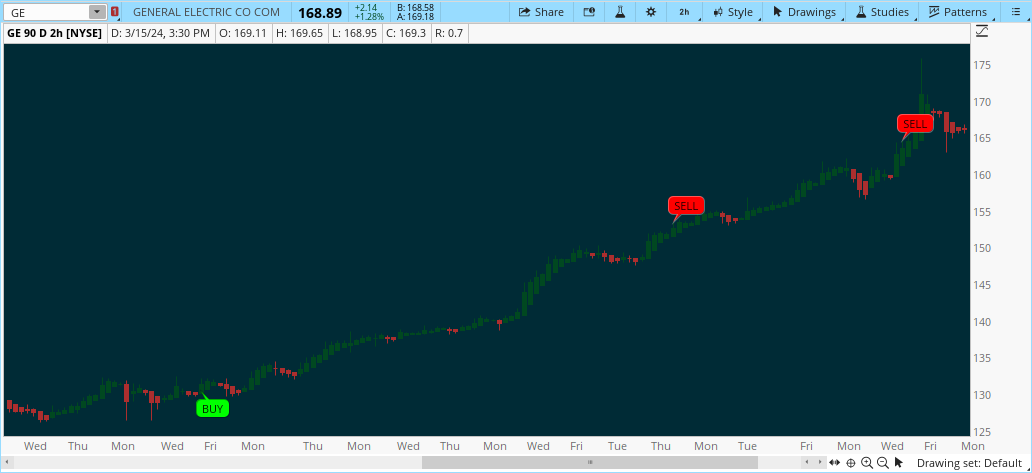
The indicator plots green "Buy" labels below the price bars when the buy condition is met.
It plots red "Sell" labels above the price bars when the sell condition is met.
Usage:
The indicator can be used on any timeframe and for any trading instrument.
Look for areas where all three divergences (RSI, MACD, and Stochastic) align to generate stronger buy and sell signals.
Consider additional technical analysis and risk management strategies to validate the signals and manage your trades effectively.
Hi coders!
Can anyone convert this Multi-Divergence Buy/Sell TradingView Indicator into a TOS indicator? Here is the link to the author's indicator: https://www.tradingview.com/script/7wVZvOkC-Multi-Divergence-Buy-Sell-Indicator/ . It is an open-source code and I take no credit for this author's indicator and any usage of author's code is strictly for personal use.
@samer800
Hi Samer. Big fan of your work here. Do you think it is possible you can evaluate this script and convert if possible?
Thanks!!
The "Multi-Divergence Buy/Sell Indicator" is a technical analysis tool that combines multiple divergence signals from different indicators to identify potential buy and sell opportunities in the market. Here's a breakdown of how the indicator works and how to use it:
Input Parameters:
RSI Length: Specifies the length of the RSI (Relative Strength Index) calculation.
MACD Short Length: Specifies the short-term length for the MACD (Moving Average Convergence Divergence) calculation.
MACD Long Length: Specifies the long-term length for the MACD calculation.
MACD Signal Smoothing: Specifies the smoothing length for the MACD signal line calculation.
Stochastic Length: Specifies the length of the Stochastic oscillator calculation.
Stochastic Overbought Level: Defines the overbought level for the Stochastic oscillator.
Stochastic Oversold Level: Defines the oversold level for the Stochastic oscillator.
Calculation of Indicators:
RSI: Calculates the RSI based on the specified RSI Length.
MACD: Calculates the MACD line, signal line, and histogram based on the specified MACD parameters.
Stochastic: Calculates the Stochastic oscillator based on the specified Stochastic parameters.
Divergence Detection:
RSI Divergence: Identifies a bullish divergence when the RSI crosses above its 14-period simple moving average (SMA).
MACD Divergence: Identifies a bullish divergence when the MACD line crosses above the signal line.
Stochastic Divergence: Identifies a bullish divergence when the Stochastic crosses above its 14-period SMA.
Buy and Sell Conditions:
Buy Condition: Triggers a buy signal when all three divergences (RSI, MACD, and Stochastic) occur simultaneously.
Sell Condition: Triggers a sell signal when both RSI and MACD divergences occur, but Stochastic divergence does not occur.
Plotting Buy/Sell Signals:
The indicator plots green "Buy" labels below the price bars when the buy condition is met.
It plots red "Sell" labels above the price bars when the sell condition is met.
Usage:
The indicator can be used on any timeframe and for any trading instrument.
Look for areas where all three divergences (RSI, MACD, and Stochastic) align to generate stronger buy and sell signals.
Consider additional technical analysis and risk management strategies to validate the signals and manage your trades effectively.
Hi coders!
Can anyone convert this Multi-Divergence Buy/Sell TradingView Indicator into a TOS indicator? Here is the link to the author's indicator: https://www.tradingview.com/script/7wVZvOkC-Multi-Divergence-Buy-Sell-Indicator/ . It is an open-source code and I take no credit for this author's indicator and any usage of author's code is strictly for personal use.
@samer800
Hi Samer. Big fan of your work here. Do you think it is possible you can evaluate this script and convert if possible?
Thanks!!
Last edited by a moderator: