Repaints Volume Multi Time Frame VMTF For ThinkOrSwim

Repaints
This is a great Multi Time Frame volume indicator. Can anyone convert this to thinkorswim. https://www.tradingview.com/script/...09JOTJaVTIxTjg3aFJlRXJjUlowa0lLR3p5TlpFNVc4ZA..
CJFu6xNd
 
Last edited by a moderator:

Join useThinkScript to post your question to a community of 21,000+ developers and traders.

Can anyone help converting this TradingView script above into TOS. Thanks in advance!

try below code. line direction reversed.

EL3D2rA.png


CSS:
#// This source code is subject to the terms of the Mozilla Public License 2.0 at https://mozilla.org/MPL/2.0/
#// © LonesomeTheBlue
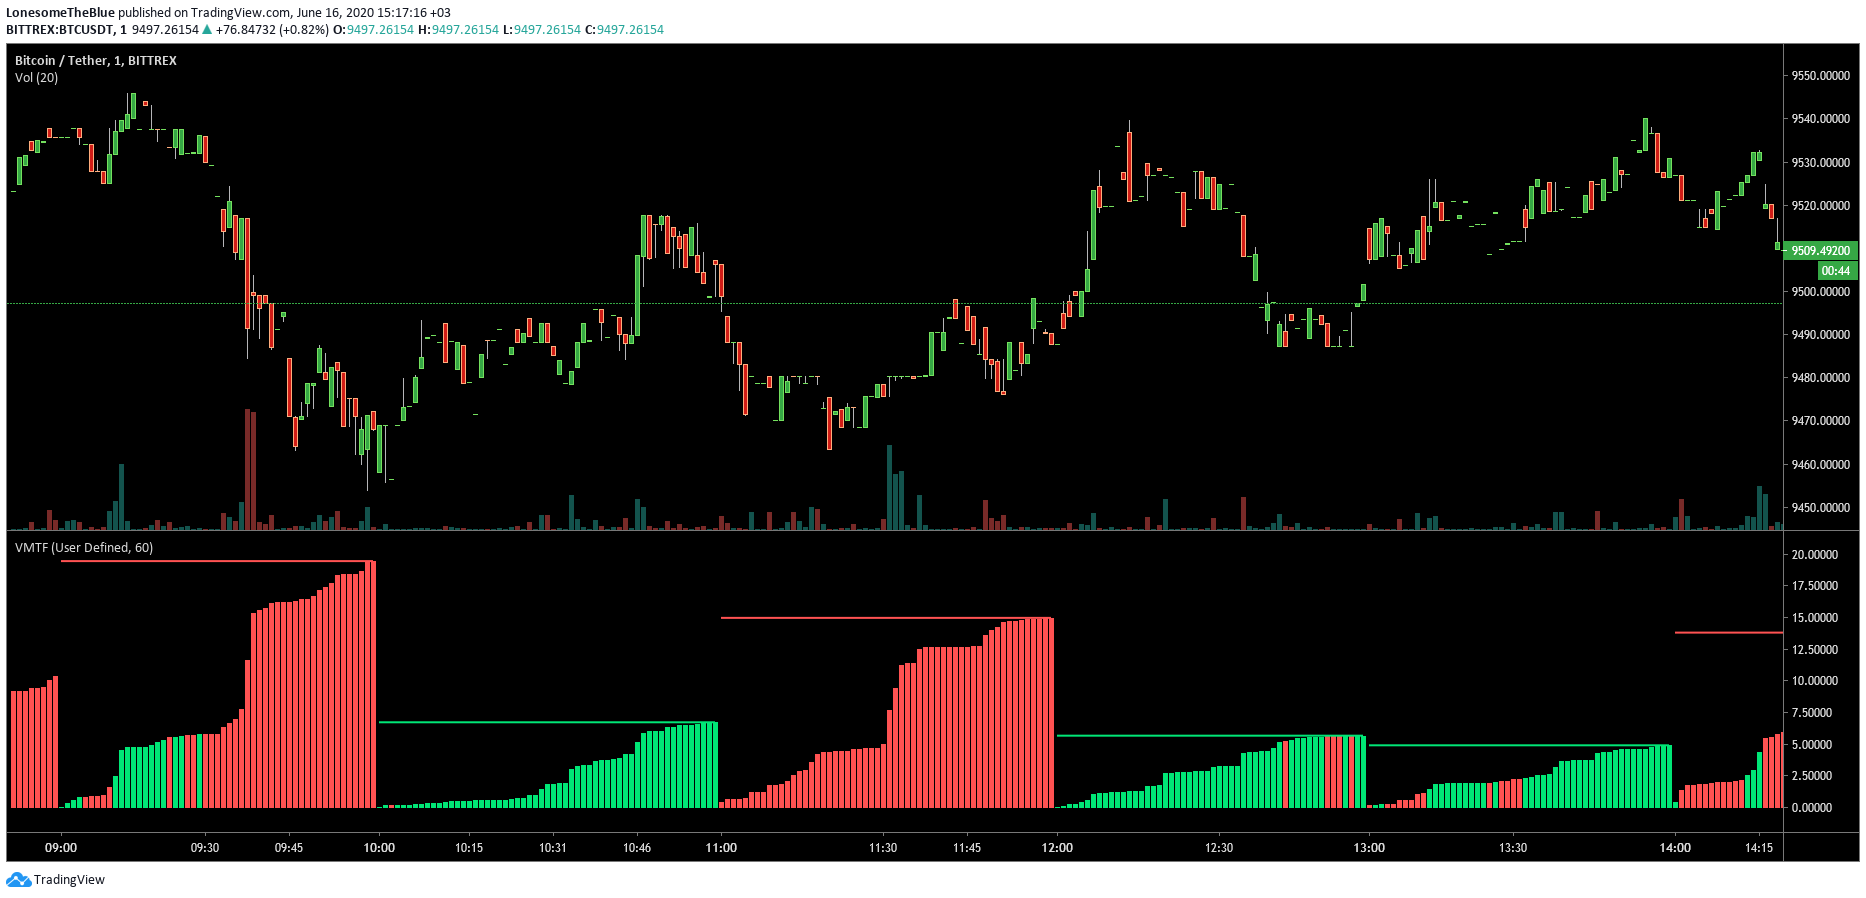
#study("Volume Multi Time Frame", "VMTF")
# Converted and mode by Sam4Cok@Samer800 - 11/2022

declare lower;
input ShowLines = yes;
input mode = {default "Auto", "User Defined"};            # "HTF Mode"
input ManualAgg = AggregationPeriod.DAY; # "Resolution (if HTF Mode is user-defined)"

def na = Double.NaN;
def agg = GetAggregationPeriod();
def day = GetDay();
def week = GetWeek();
def month = GetMonth();
def year = GetYear();
def oneMin  = AggregationPeriod.MIN;
def fiveMin = AggregationPeriod.FIVE_MIN;
def fifttenMin = AggregationPeriod.FIFTEEN_MIN;
def hour = AggregationPeriod.HOUR;
def twoHr  = AggregationPeriod.TWO_HOURS;
def fourHr = AggregationPeriod.FOUR_HOURS;
def day1   = AggregationPeriod.DAY;
def week1  = AggregationPeriod.WEEK;
def month1 = AggregationPeriod.MONTH;
def year1  = AggregationPeriod.YEAR;
#//auto higher time frame calculation
def HTFo = if agg == oneMin then fifttenMin / agg else
           if agg <= fiveMin then hour / agg else
           if agg <= twoHr then day1 / agg else
           if agg <= fourHr then week1 / agg else
           if agg <= day1 then month1 / agg else
           if agg <= month1 then year1 / agg else day1 / agg;
def AutoTF = if agg < fourHr then day else
             if agg < day1   then week else
             if agg < month1 then month else
             if agg < year1  then year else day;
def ManTF = if ManualAgg <= day1 then DAY else
            if ManualAgg <= week1 then MONTH else
            if ManualAgg < year1 then YEAR else day;
#--- Calc
def HTF = if mode == mode."Auto" then HTFo else ManualAgg / agg;
def TF  = if mode == mode."Auto" then AutoTF else ManTF;

def count = If(count[1] > HTF - 1 or TF != TF[1], 1, count[1] + 1);
def htfvol = fold i = 0 to count with p do
             p + GetValue(volume, i);
def OpenCandle = if count == 1 then open else OpenCandle[1];
def col = if close >= OpenCandle then 1 else 0;

def volValue = if htfvol > htfvol[1] then htfvol else na;
def line = CompoundValue(1, if htfvol > htfvol[1] then line[1] else volValue[1], volValue);

#--- Plot
def OpenLine = if count==1 then col[1] else OpenLine[1];
def Linecol = if OpenLine then  1 else 0;

plot volLine = if !ShowLines then na else line;
volLine.SetPaintingStrategy(PaintingStrategy.HORIZONTAL);
volLine.AssignValueColor(if Linecol then Color.GREEN  else Color.RED);

# Plot Hist
AddChart(high = if col then htfvol else na , low = 0 , open = htfvol,  close = 0,
         type = ChartType.CANDLE, growcolor =  CreateColor(0,152,0));

AddChart(high = if !col then htfvol else na  , low = 0 , open = htfvol,  close = 0,
         type = ChartType.CANDLE, growcolor =  CreateColor(128,0,0));

#--- End Code
 
Hello All, is it possible to separate buy volume from sell volume? For example on 1.12.24 YMAB buying volume ended the day 689% above 50 day volume average and selling volume ended the day 203% above 50day volume average. I know everyone can caluclate this different. This indicator is really handy in letting me know at what time overall volume crossed above the 50 day volume MA but I would like to know how much cumulative selling volume as a percent of they 50 day volume ma was present at the time of crossing.
I have a separate watch list that tells me the buying volume percent vs the sell volume percent on the day but it would be nice to moniter cumalitvely on smaller timeframe chart.
Most of the day the selling volume as percent of the 50 day volume ma was very low and it wasn't until around 1pm that it exceeded past a certain high percentage like 100%. Knowing when selling volume gets up to a certain cumulative percentage of the 50 day moving average can help in exiting a trimming a position. I know Im talking percent vs share count but I will take either. Appreciate any help.
 

Attachments

  • YMAB.png
    YMAB.png
    146.8 KB · Views: 53
Hello All, is it possible to separate buy volume from sell volume? For example on 1.12.24 YMAB buying volume ended the day 689% above 50 day volume average and selling volume ended the day 203% above 50day volume average. I know everyone can caluclate this different. This indicator is really handy in letting me know at what time overall volume crossed above the 50 day volume MA but I would like to know how much cumulative selling volume as a percent of they 50 day volume ma was present at the time of crossing.
I have a separate watch list that tells me the buying volume percent vs the sell volume percent on the day but it would be nice to moniter cumalitvely on smaller timeframe chart.
Most of the day the selling volume as percent of the 50 day volume ma was very low and it wasn't until around 1pm that it exceeded past a certain high percentage like 100%. Knowing when selling volume gets up to a certain cumulative percentage of the 50 day moving average can help in exiting a trimming a position. I know Im talking percent vs share count but I will take either. Appreciate any help.
The ToS datafeeds do not provide buy / sell volume.
 

Similar threads

Not the exact question you're looking for?

Start a new thread and receive assistance from our community.

87k+ Posts
517 Online
Create Post

Similar threads

Similar threads

The Market Trading Game Changer

Join 2,500+ subscribers inside the useThinkScript VIP Membership Club
  • Exclusive indicators
  • Proven strategies & setups
  • Private Discord community
  • ‘Buy The Dip’ signal alerts
  • Exclusive members-only content
  • Add-ons and resources
  • 1 full year of unlimited support

Frequently Asked Questions

What is useThinkScript?

useThinkScript is the #1 community of stock market investors using indicators and other tools to power their trading strategies. Traders of all skill levels use our forums to learn about scripting and indicators, help each other, and discover new ways to gain an edge in the markets.

How do I get started?

We get it. Our forum can be intimidating, if not overwhelming. With thousands of topics, tens of thousands of posts, our community has created an incredibly deep knowledge base for stock traders. No one can ever exhaust every resource provided on our site.

If you are new, or just looking for guidance, here are some helpful links to get you started.

What are the benefits of VIP Membership?
VIP members get exclusive access to these proven and tested premium indicators: Buy the Dip, Advanced Market Moves 2.0, Take Profit, and Volatility Trading Range. In addition, VIP members get access to over 50 VIP-only custom indicators, add-ons, and strategies, private VIP-only forums, private Discord channel to discuss trades and strategies in real-time, customer support, trade alerts, and much more. Learn all about VIP membership here.
How can I access the premium indicators?
To access the premium indicators, which are plug and play ready, sign up for VIP membership here.
Back
Top