
Greetings,
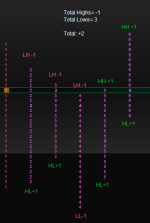
In the book "Mind Over Markets" Dalton mentions an objective measure of "what is the market trying to do" using a quick calculation. Essentially, this is counting higher high/lows and lower highs/lows on the 30min period. For example, on a 30 min candle chart, if price makes a higher high, we add +1. If it's a lower high, it's a -1. On a lower low it's a -1, and a higher low, +1.
Is there a script that measures this, or something like it. I was hoping to find some measure of "what the market is trying to do" that relies less on subjective interpretation and more on being as objective as possible.
For reference, it's on page 112.
I've attached a picture of the system. I don't need anything to be displayed, just some form of the result.
I did find this on TradingView which is very similar.
https://www.tradingview.com/script/...-Buy-Sell-Pressure-for-Market-Volume-Profile/
Any help is much appreciated.
Attachments
Last edited: