that guy over there
New member
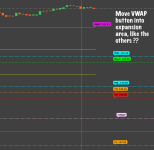
Hi, I am using this script to show VWAP with a price bubble. The bubble often gets in the way of the candles. So I would like to be able to move it to the right, into the expansion area, like the others on the chart shown. But I am a hack coder—I've tried all kinds of stuff and I just can't figure it out. Could anyone help? Many thanks in advance.
Code follows, then pic of the chart. (Apologies in advance if this is someone's code and it is not attributed ... I forget where I found it.)
input numDevDn = -2.0;
input numDevUp = 2.0;
input timeFrame = {default DAY, WEEK, MONTH};
input length = 1;
input showOnlyLastPeriod = yes;
def bn = BarNumber();
def na = Double.NaN;
def h = high;
def l = low;
def o = open;
def c = close;
def v = volume;
def aggregationPeriod = AggregationPeriod.DAY;
def displace = -1;
def cap = getAggregationPeriod();
def errorInAggregation =
timeFrame == timeFrame.DAY and cap >= AggregationPeriod.WEEK or
timeFrame == timeFrame.WEEK and cap >= AggregationPeriod.MONTH;
assert(!errorInAggregation, "timeFrame should be not less than current chart aggregation period");
def yyyyMmDd = getYyyyMmDd();
def periodIndx;
switch (timeFrame) {
case DAY:
periodIndx = yyyyMmDd;
case WEEK:
periodIndx = Floor((daysFromDate(first(yyyyMmDd)) + getDayOfWeek(first(yyyyMmDd))) / 7);
case MONTH:
periodIndx = roundDown(yyyyMmDd / 100, 0);
}
def isPeriodRolled = compoundValue(1, periodIndx != periodIndx[1], yes);
def volumeSum;
def volumeVwapSum;
def volumeVwap2Sum;
if (isPeriodRolled) {
volumeSum = volume;
volumeVwapSum = volume * vwap;
volumeVwap2Sum = volume * Sqr(vwap);
} else {
volumeSum = compoundValue(1, volumeSum[1] + volume, volume);
volumeVwapSum = compoundValue(1, volumeVwapSum[1] + volume * vwap, volume * vwap);
volumeVwap2Sum = compoundValue(1, volumeVwap2Sum[1] + volume * Sqr(vwap), volume * Sqr(vwap));
}
def price = volumeVwapSum / volumeSum;
def deviation = Sqrt(Max(volumeVwap2Sum / volumeSum - Sqr(price), 0));
plot VWAP = price;
plot UpperBand = price + numDevUp * deviation;
plot LowerBand = price + numDevDn * deviation;
VWAP.setDefaultColor(getColor(0));
UpperBand.setDefaultColor(getColor(2));
LowerBand.setDefaultColor(getColor(4));
def x0 = if(isNaN(close[-1]) and !isNaN(close), barNumber(), x0[1]);
AddChartBubble(barNumber() == highestAll(x0)-0, VWAP, "VWAP: " + RoundUp(VWAP), Color.MAGENTA);

