declare Hide_On_Daily;
declare Once_per_bar;


input OrMeanS  = 0930.0; #hint OrMeanS: Begin Mean Period. Usually Market Open EST.
input OrMeanE  = 0935.0; #hint OrMeanE: End Mean period. Usually End of first bar.
input OrBegin  = 0930.0; #hint OrBegin: Beginning for Period of Opening Range Breakout.
input OrEnd    = 1000.0; #hint OrEnd: End of Period of Opening Range Breakout.
input CloudOn  = no;     #hint CloudOn: Clouds Opening Range.
input AlertOn  = yes;    #hint AlertOn: Alerts on cross of Opening Range.
input ShowTodayOnly = {"No", default "Yes"};
input nAtr = 4;          #hint nATR: Lenght for the ATR Risk and Target Lines.
input AtrTargetMult = 2.0; #hint ATRmult: Multiplier for the ATR calculations.

  def h = high;
  def l = low;
  def c = close;
  def bar = barNumber();
  def s = ShowTodayOnly;
  def ORActive = if secondsTillTime(OrMeanE) > 0 and
                    secondsFromTime(OrMeanS) >= 0
                 then 1
                 else 0;
  def today = if s == 0
              or getDay() == getLastDay() and
                 secondsFromTime(OrMeanS) >= 0
              then 1
              else 0;
  def ORHigh = if ORHigh[1] == 0
               or ORActive[1] == 0 and
                  ORActive == 1
               then h
               else if ORActive and
                       h > ORHigh[1]
               then h
               else ORHigh[1];
  def ORLow = if ORLow[1] == 0
              or ORActive[1] == 0 and
                 ORActive == 1
              then l
              else if ORActive and
                      l < ORLow[1]
              then l
              else ORLow[1];
  def ORWidth = ORHigh - ORLow;
  def na = double.nan;
  def ORHA = if ORActive
             or today < 1
             then na
             else ORHigh;
  def ORLA = if ORActive
             or today < 1
             then na
             else ORLow;
  def O = ORHA - Round(((ORHA - ORLA) / 2) / TickSize(), 0) * TickSize();
  def ORActive2 = if secondsTillTime(OREnd) > 0 and
                     secondsFromTime(ORBegin) >= 0
                  then 1
                  else 0;
  def ORHigh2 = if ORHigh2[1] == 0
                  or ORActive2[1] == 0 and
                     ORActive2 == 1
                then h
                else if ORActive2 and
                        h > ORHigh2[1]
                then h
                else ORHigh2[1];
  def ORLow2 = if ORLow2[1] == 0
                or ORActive2[1] == 0 and
                   ORActive2 == 1
               then l
               else if ORActive2 and
                       l < ORLow2[1]
               then l
               else ORLow2[1];
  def ORWidth2 = ORHigh2 - ORLow2;
  def TimeLine = if secondsTillTime(OREnd) == 0
                 then 1
                 else 0;
  def ORmeanBar = if !ORActive and ORActive[1]
                  then barNumber()
                  else ORmeanBar[1];
  def ORendBar = if !ORActive2 and ORActive2[1]
                 then barNumber()
                 else ORendBar[1];
  def ORL = if (o == 0 , na, o);
plot ORLext = if barNumber() >= highestAll(ORmeanBar)
              then HighestAll(if isNaN(c[-1])
                              then ORL[1]
                              else double.nan)
              else double.nan;
     ORLext.SetDefaultColor(color.Yellow);
     ORLext.SetStyle(curve.Long_DASH);
     ORLext.SetLineWeight(3);
     ORLext.HideTitle();
  def ORH2 = if ORActive2
             or today < 1
             then na
             else ORHigh2;
plot ORH2ext = if barNumber() >= highestAll(ORendBar)
               then HighestAll(if isNaN(c[-1])
                               then ORH2[1]
                               else double.nan)
               else double.nan;
     ORH2ext.SetDefaultColor(color.Green);
     ORH2ext.SetStyle(curve.Long_DASH);
     ORH2ext.SetLineWeight(3);
     ORH2ext.HideTitle();
  def ORL2 = if ORActive2
               or today < 1
             then na
             else ORLow2;
plot ORL2ext = if barNumber() >= highestAll(ORendBar)
               then HighestAll(if isNaN(c[-1])
                               then ORL2[1]
                               else double.nan)
               else double.nan;
     ORL2ext.SetDefaultColor(color.Red);
     ORL2ext.SetStyle(curve.Long_DASH);
     ORL2ext.SetLineWeight(3);
     ORL2ext.HideTitle();
  def RelDay = (ORL - ORL2) / (ORH2 - ORL2);
  def dColor = if RelDay > .5
               then 5
               else if RelDay < .5
                    then 6
               else 4;
  def pos = (ORH2 - ORL2)/10;
plot d1 = if (TimeLine , ORH2, na);
plot d2 = if (TimeLine , ORH2 - ( pos * 2), na);
plot d3 = if (TimeLine , ORH2 - ( pos * 3), na);
plot d4 = if (TimeLine , ORH2 - ( pos * 4), na);
plot d5 = if (TimeLine , ORH2 - ( pos * 5), na);
plot d6 = if (TimeLine , ORH2 - ( pos * 6), na);
plot d7 = if (TimeLine , ORH2 - ( pos * 7), na);
plot d8 = if (TimeLine , ORH2 - ( pos * 8), na);
plot d9 = if (TimeLine , ORH2 - ( pos * 9), na);
plot d10 = if (TimeLine ,(ORL2), na);
     d1.SetPaintingStrategy(PaintingStrategy.POINTS);
     d2.SetPaintingStrategy(PaintingStrategy.POINTS);
     d3.SetPaintingStrategy(PaintingStrategy.POINTS);
     d4.SetPaintingStrategy(PaintingStrategy.POINTS);
     d5.SetPaintingStrategy(PaintingStrategy.POINTS);
     d6.SetPaintingStrategy(PaintingStrategy.POINTS);
     d7.SetPaintingStrategy(PaintingStrategy.POINTS);
     d8.SetPaintingStrategy(PaintingStrategy.POINTS);
     d9.SetPaintingStrategy(PaintingStrategy.POINTS);
    d10.SetPaintingStrategy(PaintingStrategy.POINTS);
     d1.AssignValueColor(GetColor(Dcolor));
     d2.AssignValueColor(GetColor(Dcolor));
     d3.AssignValueColor(GetColor(Dcolor));
     d4.AssignValueColor(GetColor(Dcolor));
     d5.AssignValueColor(GetColor(Dcolor));
     d6.AssignValueColor(GetColor(Dcolor));
     d7.AssignValueColor(GetColor(Dcolor));
     d8.AssignValueColor(GetColor(Dcolor));
     d9.AssignValueColor(GetColor(Dcolor));
    d10.AssignValueColor(GetColor(Dcolor));
     d1.HideBubble();
     d2.HideBubble();
     d3.HideBubble();
     d4.HideBubble();
     d5.HideBubble();
     d6.HideBubble();
     d7.HideBubble();
     d8.HideBubble();
     d9.HideBubble();
    d10.HideBubble();
     d1.HideTitle();
     d2.HideTitle();
     d3.HideTitle();
     d4.HideTitle();
     d5.HideTitle();
     d6.HideTitle();
     d7.HideTitle();
     d8.HideTitle();
     d9.HideTitle();
    d10.HideTitle();
addCloud(if CloudOn == yes
         then orl
         else double.nan
       , orl2,createColor(244,83,66), createColor(244,83,66));
addCloud(if CloudOn == yes
         then orl
         else double.nan
       , orh2,createColor(66,244,131), createColor(66,244,131));
# Begin Risk Algorithm
# First Breakout or Breakdown bars
  def Bubbleloc1 = isNaN(close[-1]);
  def BreakoutBar = if ORActive
                    then double.nan
                    else if !ORActive and c crosses above ORH2
                         then bar
                         else if !isNaN(BreakoutBar[1]) and c crosses ORH2
                              then BreakoutBar[1]
                    else BreakoutBar[1];
  def ATR = if ORActive2
  then Round((Average(TrueRange(h, c, l), nATR)) / TickSize(), 0) * TickSize()
  else ATR[1];
  def cond1 =  if h > ORH2 and
                  h[1] <= ORH2
               then Round((ORH2  + (ATR * AtrTargetMult)) / TickSize(), 0) * TickSize()
               else cond1[1];
plot ORLriskUP = if bar >= OREndBar and !ORActive and today
                 then HighestAll(ORH2ext - 2)
                 else double.nan;
     ORLriskUP.SetStyle(Curve.Long_Dash);
     ORLriskUP.SetDefaultColor(Color.Green);
     ORLriskUP.HideTitle();
  def crossUpBar = if close crosses above ORH2
                   then bar
                   else double.nan;
AddChartBubble(bar == HighestAll(crossUpBar), ORLriskUP, "RiskON ORH", color.green, no);
plot ORLriskDN = if bar >= OREndBar and !ORActive and close < ORL
                 then HighestAll(ORL2ext + 2)
                 else double.nan;
     ORLriskDN.SetStyle(Curve.Long_Dash);
     ORLriskDN.SetDefaultColor(Color.Red);
     ORLriskDN.HideTitle();
  def crossDnBar = if close crosses below ORL2ext
                   then bar
                   else double.nan;
AddChartBubble(bar == HighestAll(crossDnBar), HighestAll(ORLriskDN), "Risk ON ORL", color.red, yes);
# High Targets
plot Htarget = if bar >= BreakoutBar
               then cond1
               else double.nan;
     Htarget.SetPaintingStrategy(paintingStrategy.Squares);
     Htarget.SetLineWeight(1);
     Htarget.SetDefaultColor(Color.White);
     Htarget.HideTitle();
AddChartBubble(BubbleLoc1, Htarget, "RO", color.white, if c > Htarget then no else yes);
  def condHtarget2 = if c crosses above cond1
  then Round((cond1 + (ATR * AtrTargetMult)) / TickSize(), 0) * TickSize()
  else condHtarget2[1];
plot Htarget2 = if bar >= BreakoutBar
                then  condHtarget2
                else double.nan;
     Htarget2.SetPaintingStrategy(PaintingStrategy.Squares);
     Htarget2.SetLineWeight(1);
     Htarget2.SetDefaultColor(Color.Plum);
     Htarget2.HideTitle();
AddChartBubble(BubbleLoc1, Htarget2, "2nd T", color.plum, if c > Htarget2
                                                          then no
                                                          else yes);
  def condHtarget3 = if c crosses above condHtarget2
  then Round((condHtarget2 + (ATR * AtrTargetMult)) / TickSize(), 0) * TickSize()
  else condHtarget3[1];
plot Htarget3 = if bar >= BreakoutBar
                then condHtarget3
                else double.nan;
     Htarget3.SetPaintingStrategy(PaintingStrategy.Squares);
     Htarget3.SetLineWeight(1);
     Htarget3.SetDefaultColor(Color.Plum);
     Htarget3.HideTitle();
AddChartBubble(isNaN(C[-1]), Htarget3, "3rd T", color.plum, if c > Htarget3 then no else yes);
  def condHtarget4 = if c crosses above condHtarget3
  then Round((condHtarget3 + (ATR * AtrTargetMult)) / TickSize(), 0) * TickSize()
  else condHtarget4[1];
plot Htarget4 = if bar >= HighestAll(BreakoutBar)
                then condHtarget4
                else double.nan;
     Htarget4.SetPaintingStrategy(PaintingStrategy.Squares);
     Htarget4.SetLineWeight(1);
     Htarget4.SetDefaultColor(Color.Plum);
     Htarget4.HideTitle();
AddChartBubble(BubbleLoc1, Htarget4, "4th T", color.plum, if c > Htarget4 then no else yes);
  def condHtarget5 = if c crosses above condHtarget4
  then Round((condHtarget4 + (ATR * AtrTargetMult)) / TickSize(), 0) * TickSize()
  else condHtarget5[1];
plot Htarget5 = if bar >= BreakoutBar
                then condHtarget5
                else double.nan;
     Htarget5.SetPaintingStrategy(PaintingStrategy.Squares);
     Htarget5.SetLineWeight(1);
     Htarget5.SetDefaultColor(Color.Plum);
     Htarget5.HideTitle();
AddChartBubble(BubbleLoc1, Htarget5, "5th T", color.plum, if c > Htarget5 then no else yes);
# Low Targets
  def cond2 = if L < ORL2 and
                 L[1] >= ORL2
              then Round((ORL2  - (AtrTargetMult * ATR)) / TickSize(), 0) * TickSize()
              else cond2[1];
plot Ltarget =  if bar >= HighestAll(OREndBar)
                then highestAll(if isNaN(c[-1])
                                then cond2
                                else double.nan)
                else double.nan;
     Ltarget.SetPaintingStrategy(PaintingStrategy.Squares);
     Ltarget.SetLineWeight(1);
     Ltarget.SetDefaultColor(Color.White);
     Ltarget.HideTitle();
AddChartBubble(BubbleLoc1, cond2, "RO", color.white, if c < Ltarget
                                                     then yes
                                                     else no);
  def condLtarget2 = if c crosses below cond2
  then Round((cond2 - (AtrTargetMult * ATR)) / TickSize(), 0) * TickSize()
  else condLtarget2[1];
plot Ltarget2 =  if bar >= HighestAll(OREndBar)
                 then highestAll(if isNaN(c[-1])
                                 then condLtarget2
                                 else double.nan)
                 else double.nan;
     Ltarget2.SetPaintingStrategy(PaintingStrategy.Squares);
     Ltarget2.SetLineWeight(1);
     Ltarget2.SetDefaultColor(Color.Plum);
     Ltarget2.HideTitle();
AddChartBubble(BubbleLoc1, condLtarget2, "2nd T", color.plum, if c < condLtarget2
                                                              then yes
                                                              else no);
  def condLtarget3 = if c crosses below condLtarget2
  then Round((condLtarget2 - (AtrTargetMult * ATR)) / TickSize(), 0) * TickSize()
  else condLtarget3[1];
plot Ltarget3 = if bar >= HighestAll(OREndBar)
                then highestAll(if isNaN(c[-1])
                                then condLtarget3
                                else double.nan)
                else double.nan;
     Ltarget3.SetPaintingStrategy(PaintingStrategy.Squares);
     Ltarget3.SetLineWeight(1);
     Ltarget3.SetDefaultColor(Color.Plum);
     Ltarget3.HideTitle();
AddChartBubble(BubbleLoc1, condLtarget3, "3rd T", color.plum, if c < Ltarget3
                                                              then yes
                                                              else no);
  def condLtarget4 = if c crosses condLtarget3
  then Round((condLtarget3 - (AtrTargetMult * ATR)) / TickSize(), 0) * TickSize()
  else condLtarget4[1];
plot Ltarget4 = if bar >= HighestAll(OREndBar)
                then highestAll(if isNaN(c[-1])
                                then condLtarget4
                                else double.nan)
                else double.nan;
     Ltarget4.SetPaintingStrategy(PaintingStrategy.Squares);
     Ltarget4.SetLineWeight(1);
     Ltarget4.SetDefaultColor(Color.Plum);
     Ltarget4.HideTitle();
AddChartBubble(BubbleLoc1, condLtarget4, "4th T", color.plum, if c < Ltarget4
                                                              then yes
                                                              else no);
  def condLtarget5 = if c crosses condLtarget4
  then Round((condLtarget4 - (AtrTargetMult * ATR)) / TickSize(), 0) * TickSize()
  else condLtarget5[1];
plot Ltarget5 = if bar >= HighestAll(OREndBar)
                then highestAll(if isNaN(c[-1])
                                then condLtarget5
                                else double.nan)
                else double.nan;
     Ltarget5.SetPaintingStrategy(PaintingStrategy.Squares);
     Ltarget5.SetLineWeight(1);
     Ltarget5.SetDefaultColor(Color.Plum);
     Ltarget5.HideTitle();
AddChartBubble(BubbleLoc1, condLtarget5, "5th T", color.plum, if c < Ltarget5
                                                              then yes
                                                              else no);
def last = if secondsTillTime(1600) == 0 and
              secondsFromTime(1600) == 0
           then c[1]
           else last[1];
plot LastClose = if Today and last != 0
                 then last
                 else Double.NaN;
     LastClose.SetPaintingStrategy(PaintingStrategy.Dashes);
     LastClose.SetDefaultColor(Color.White);
     LastClose.HideBubble();
     LastClose.HideTitle();
AddChartBubble(SecondsTillTime(0930) == 0, LastClose, "PC", color.gray, yes);
alert(c crosses above ORH2, "", Alert.Bar, Sound.Bell);
alert(c crosses below ORL2, "", Alert.Bar, Sound.Ring);

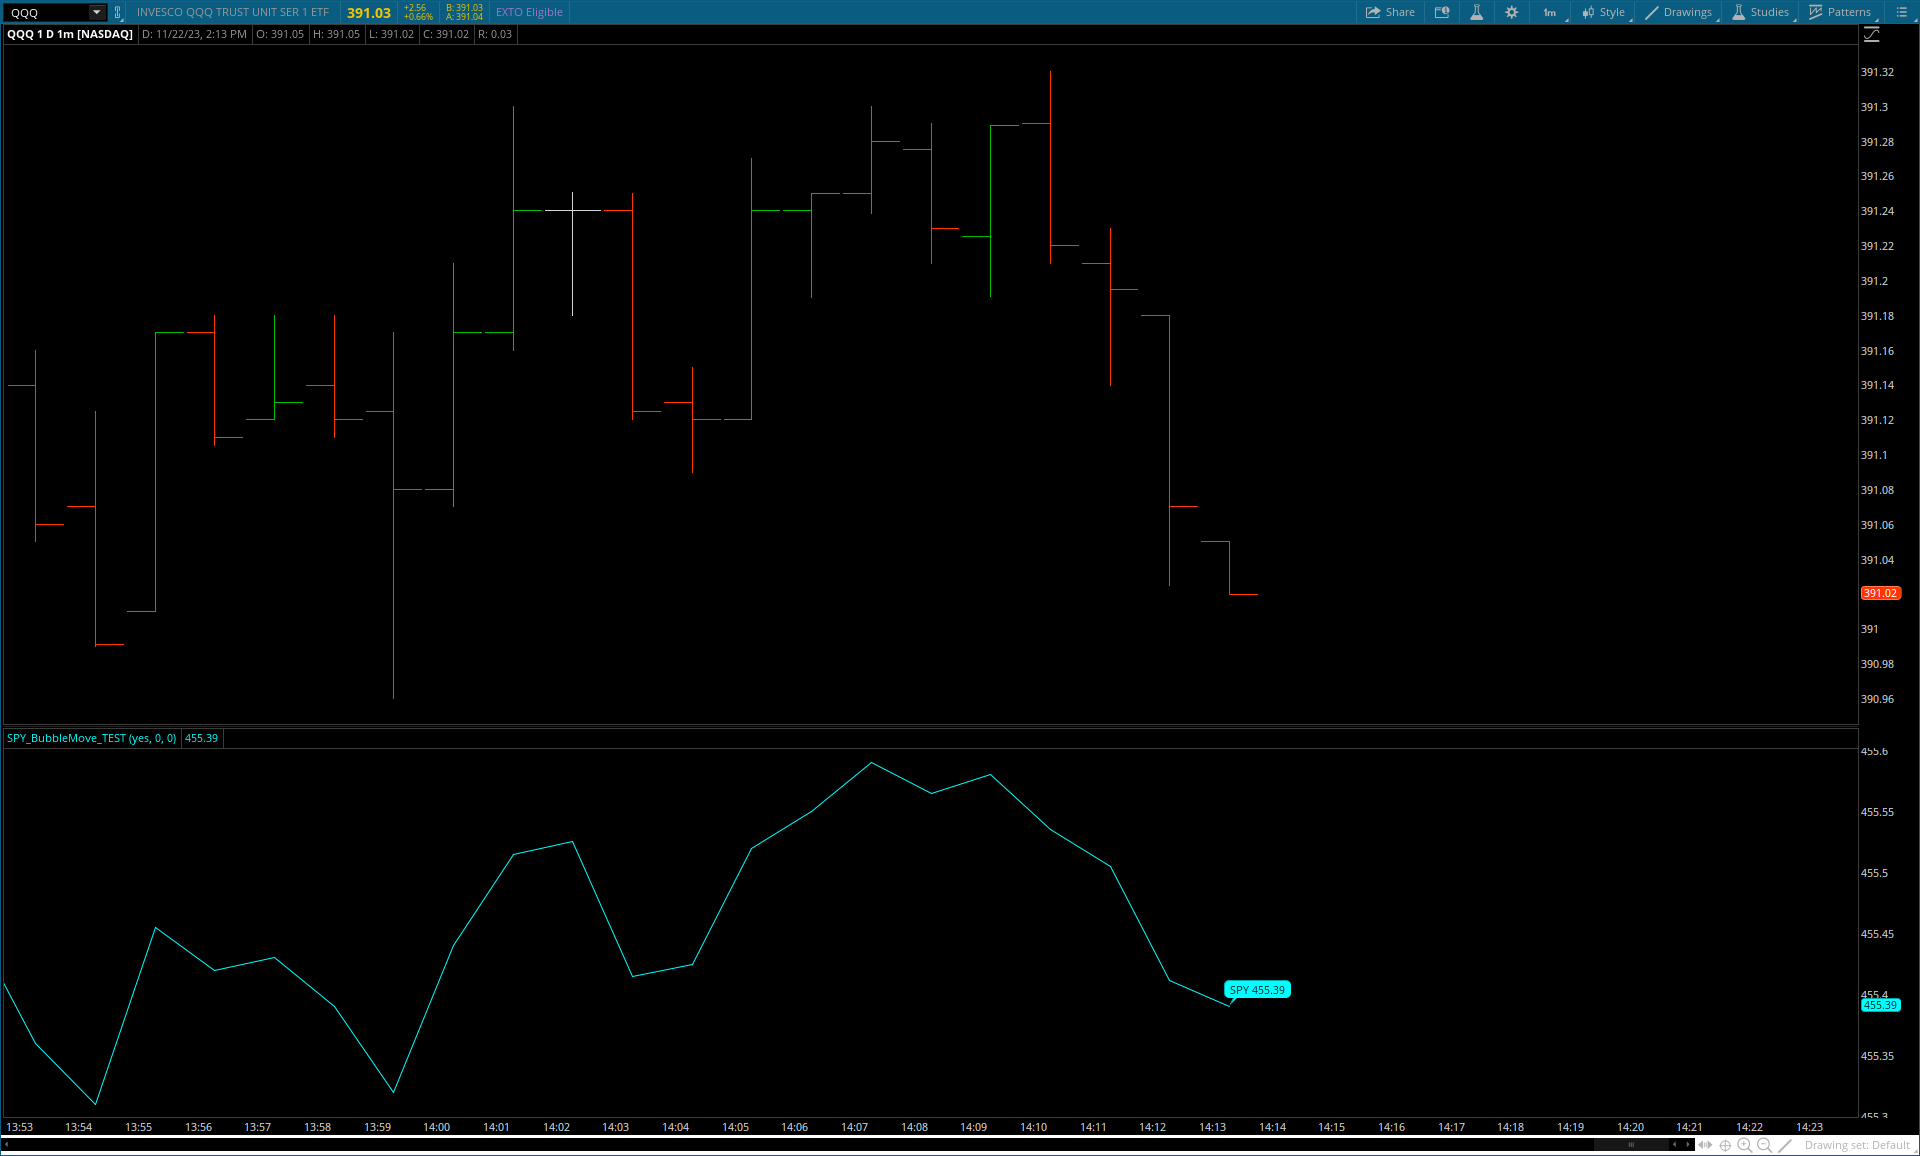
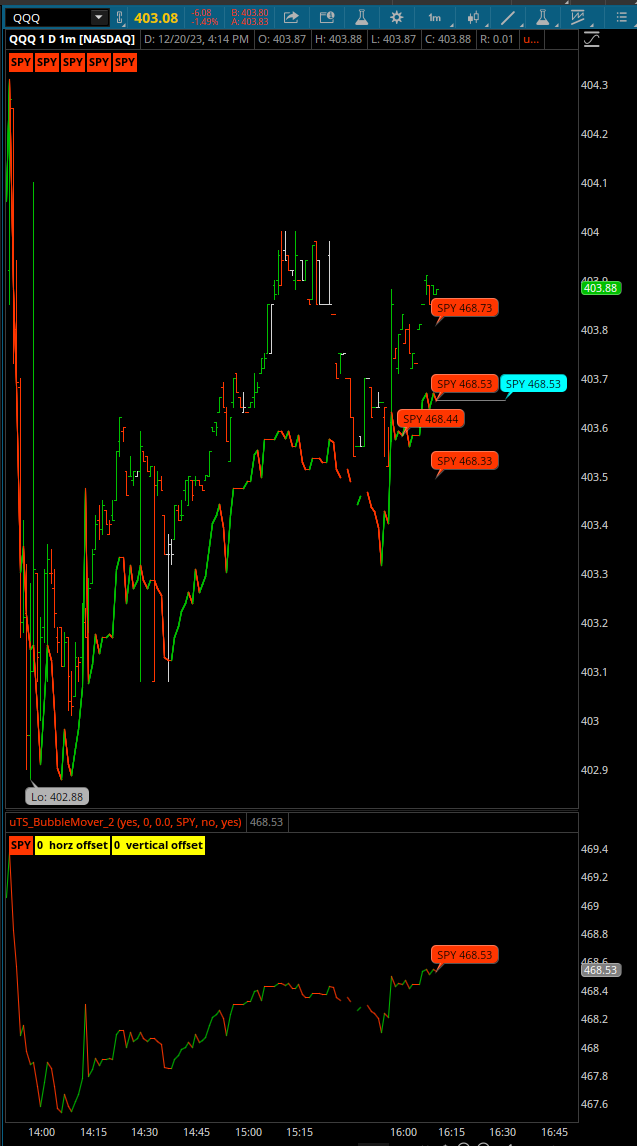
 . If you look at the screenshot, I would like all of those instances of a bubble, moved to the right 8 bars or so