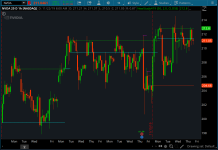
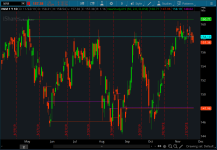
This indicator plot pivot points based on Bollinger Bands. Useful for finding potential support and resistance.


If your chart gets shrunk after adding the indicator, then left-click on the screen > Chart Scale > untick Fit studies.
If your chart gets shrunk after adding the indicator, then left-click on the screen > Chart Scale > untick Fit studies.
thinkScript Code
Code:
# Bollinger Bands Pivot Points
# Assembled by BenTen at useThinkScript.com
# Converted from https://www.tradingview.com/script/OIRD4yQB/

input length = 50;
input mult = 2.0;
input src = close;

def basis = simpleMovingAvg(src, length);
def dev = mult * stdev(src, length);
def upper = basis + dev;
def lower = basis - dev;

def pivot1 = if close[1]>upper[1] and close<upper then close[1] else pivot1[1];
def pivot2 = if close[1]<lower[1] and close> lower then open[1] else pivot2[1];
def pivot3 = if close[1]<upper[1] and close>upper then low else pivot3[1];
def pivot4 = if close[1]>lower[1] and close<lower then high else pivot4[1];

plot line1 = pivot1;
plot line2 = pivot2;
plot line3 = pivot3;
plot line4 = pivot4;

line1.SetPaintingStrategy(PaintingStrategy.HORIZONTAL);
line1.SetDefaultColor(Color.UPTICK);
line1.SetLineWeight(1);
line2.SetPaintingStrategy(PaintingStrategy.HORIZONTAL);
line2.SetDefaultColor(Color.DOWNTICK);
line2.SetLineWeight(1);
line3.SetPaintingStrategy(PaintingStrategy.HORIZONTAL);
line3.SetDefaultColor(Color.CYAN);
line3.SetLineWeight(1);
line4.SetPaintingStrategy(PaintingStrategy.HORIZONTAL);
line4.SetDefaultColor(Color.MAGENTA);
line4.SetLineWeight(1);;

