
I modified the script little to avoid repainting - pls check
Author Message -
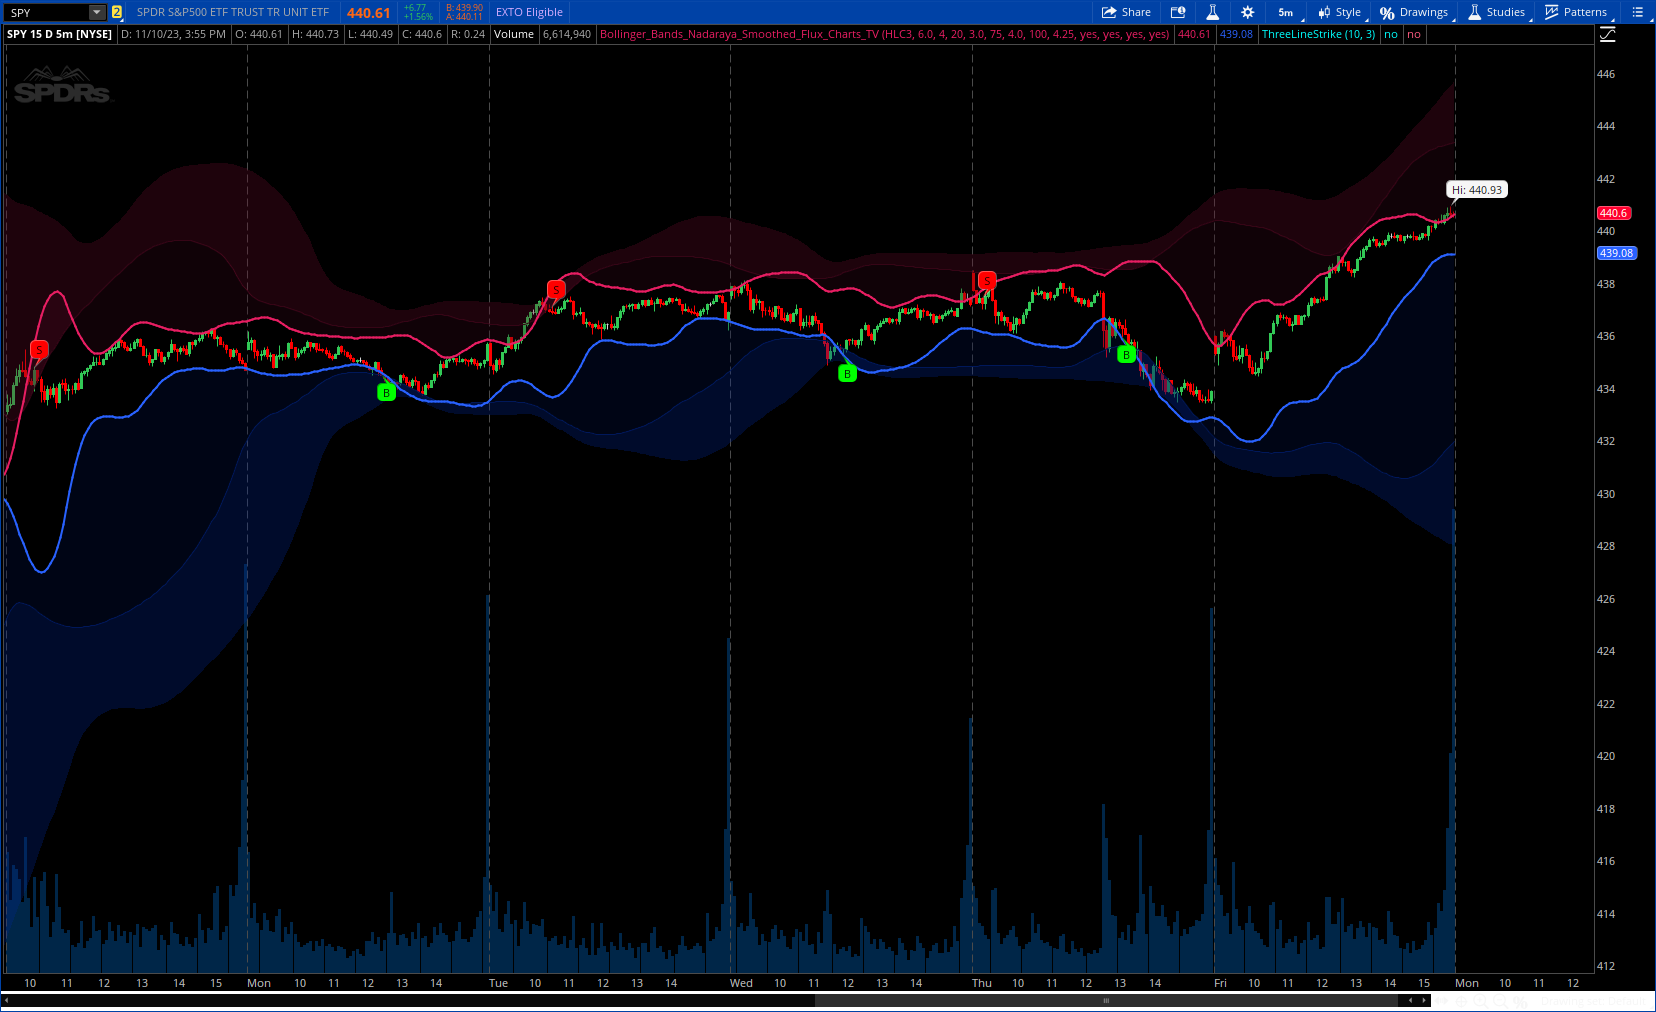
This script is an upgrade to the classic Bollinger Bands. The idea behind Bollinger bands is the detection of price movements outside of a stock's typical fluctuations. Bollinger Bands use a moving average over period n plus/minus the standard deviation over period n times a multiplier. When price closes above or below either band this can be considered an abnormal movement. This script allows for the classic Bollinger Band interpretation while de-noising or "smoothing" the bands.
CODE:
CSS:
# https://www.tradingview.com/v/LUoxSDKw/
#// This source code is subject to the terms of the Mozilla Public License 2.0
#// © fluxchart
#indicator("Bollinger Bands (Nadaraya Smoothed) | Flux Charts", overlay =
# Converted and mod by Sam4Cok@Samer800    - 11/2023
input src = hlc3;
input SmoothingFactor = 6.0;    # "Smoothing Factor"
input BollingerMovAvgType = AverageType.SIMPLE;
input short_period = 20;        # "Period"
input short_stdev = 3.0;        # "Deviation"
input med_period = 75;          # "Period"
input med_stdev = 4.0;          # "Deviation"
input long_period = 100;        # " Period"
input long_stdev = 4.25;        # "Deviation"
input showSignals = yes;        # "Labels"
input signalLookback = 3;
input plotsLines = yes;         # "Plot Lines"
input showBand1 = yes;          # "Level 1 Bands"
input showBand2 = yes;          # "Level 2 Bands"

def na = Double.NaN;
def n_first = short_period;
def n_second = med_period;
def n_third = long_period;
DefineGlobalColor("up",  CreateColor(41, 98, 255));
DefineGlobalColor("dn",  CreateColor(233, 30, 99));
DefineGlobalColor("up1", CreateColor(0, 18, 68));
DefineGlobalColor("dn1", CreateColor(54, 5, 22));
DefineGlobalColor("up2", CreateColor(0, 38, 144));
DefineGlobalColor("dn2", CreateColor(100, 10, 41));

#bollingers(n, factor = 3) =>
script bollingers {
    input src = hlc3;
    input len = 20;
    input factor = 3;
    input MovAvg = AverageType.SIMPLE;
    def Avg = MovingAverage(MovAvg, src, len);
    def dev = factor * StDev(src, len);
    def bolu = Avg + dev;
    def bold = Avg - dev;
    plot up = bolu;
    plot dn = bold;
}
script nadaraya {
    input src = hlc3;
    input h = 6;
    input n = 500;
    def bar = AbsValue(BarNumber());
    def den = 2 * Sqr(h);
    def gk_sum = if Bar == 0 then
                 fold i = 0 to n with p do
                 p + Exp(- Sqr(i) / den) else gk_sum[1];
    def smoothed = fold j = 0 to n with q do
                 q + src[j] * Exp(- Sqr(j) / den) / gk_sum;
    plot out = smoothed;
}
def BOLU_FIRST = bollingers(src, n_first, short_stdev, BollingerMovAvgType).up;
def BOLD_FIRST = bollingers(src, n_first, short_stdev, BollingerMovAvgType).dn;

def BOLU_SECOND = bollingers(src, n_second, short_stdev, BollingerMovAvgType).up;
def BOLD_SECOND = bollingers(src, n_second, short_stdev, BollingerMovAvgType).dn;

def BOLU_THIRD = bollingers(src, n_third, med_stdev, BollingerMovAvgType).up;
def BOLD_THIRD = bollingers(src, n_third, med_stdev, BollingerMovAvgType).dn;

def BOLU_FOURTH = bollingers(src, n_third, long_stdev, BollingerMovAvgType).up;
def BOLD_FOURTH = bollingers(src, n_third, long_stdev, BollingerMovAvgType).dn;

def pivot_high = high < Highest(src, signalLookback);
def pivot_low  = low  > Lowest (src, signalLookback);

def n = 500;

def smoothed_bolu_1 = nadaraya(BOLU_FIRST, SmoothingFactor, n);
def smoothed_bold_1 = nadaraya(BOLD_FIRST, SmoothingFactor, n);

def smoothed_bolu_2 = nadaraya(BOLU_SECOND, SmoothingFactor, n);
def smoothed_bold_2 = nadaraya(BOLD_SECOND, SmoothingFactor, n);

def smoothed_bolu_3 = nadaraya(BOLU_THIRD, SmoothingFactor, n);
def smoothed_bold_3 = nadaraya(BOLD_THIRD, SmoothingFactor, n);

def smoothed_bolu_4 = nadaraya(BOLU_FOURTH, SmoothingFactor, n);
def smoothed_bold_4 = nadaraya(BOLD_FOURTH, SmoothingFactor, n);

def BOLU_FIRST_PLOT = smoothed_bolu_1;
def BOLD_FIRST_PLOT = smoothed_bold_1;

def BOLU_SECOND_PLOT = smoothed_bolu_2;
def BOLD_SECOND_PLOT = smoothed_bold_2;

def BOLU_THIRD_PLOT = smoothed_bolu_3;
def BOLD_THIRD_PLOT = smoothed_bold_3;

def BOLU_FOURTH_PLOT = smoothed_bolu_4;
def BOLD_FOURTH_PLOT = smoothed_bold_4;

plot bearLine = if plotsLines then BOLU_FIRST_PLOT else na;
plot bullLine = if plotsLines then BOLD_FIRST_PLOT else na;
bearLine.SetLineWeight(2);
bullLine.SetLineWeight(2);
bearLine.SetDefaultColor(GlobalColor("dn"));
bullLine.SetDefaultColor(GlobalColor("up"));

AddCloud(if showBand1 then BOLU_FIRST_PLOT else na, BOLU_SECOND_PLOT, GlobalColor("dn1"), GlobalColor("dn1"), yes);
AddCloud(if showBand1 then BOLD_FIRST_PLOT else na, BOLD_SECOND_PLOT, GlobalColor("up1"), GlobalColor("up1"), yes);
AddCloud(if showBand2 then BOLU_SECOND_PLOT else na, BOLU_THIRD_PLOT, GlobalColor("dn2"), GlobalColor("dn2"));
AddCloud(if showBand2 then BOLD_SECOND_PLOT else na, BOLD_THIRD_PLOT, GlobalColor("up2"), GlobalColor("up2"));

def upper_band_test = pivot_high and src crosses BOLU_FIRST_PLOT;
def lower_band_test = pivot_low  and src crosses BOLD_FIRST_PLOT;
def cntUp = if upper_band_test then 0 else cntUp[1] + 1;
def cntDn = if lower_band_test then 0 else cntDn[1] + 1;

AddChartBubble(showSignals and cntUp == 2, high, "S", Color.RED);
AddChartBubble(showSignals and cntDn == 2, low, "B", Color.GREEN, no);

#-- END of CODE