
@guyonabuffalo Not sure if it would fit your trading style but if you like the Waddah Attar Explosion and Ray Bull Power indicators then you might also like the Didi Index indicator... It can help stay in trends longer even when they may not look like trends... I run a modified version of the one posted here in the forums at https://usethinkscript.com/threads/...erts-and-mtf-scanner-for-tos.4793/#post-44440... Not sure if will help you or not but I've used it with several setups...
You are using an out of date browser. It may not display this or other websites correctly.
You should upgrade or use an alternative browser.
You should upgrade or use an alternative browser.
blackFLAG FTS - SwingArm Trend Indicator using ATRTrailing Stop and Fibonacci Retracements
- Status
- Not open for further replies.
I need some help in creating a label for the Swingarm zone that displays the distance from the trailing stop line to the Fib3 line and based on that display the position size to take based on the dollar risk set in the label parameters. I have found a similar label on the forum and think it can be used as reference / modification.
Edit: With my limited copy and paste knowledge I combined the two together.")
Edit: With my limited copy and paste knowledge I combined the two together.
Code:
input RiskUnit = 100;
input AggregationPeriod = AggregationPeriod.FIFTEEN_MIN;

def highVal = Round(Fib3, 2);
def lowVal = Round(TrailingStop, 2);

AddLabel(
    yes,
    "High: " + highVal + " Low: " + lowVal,
    Color.Gray
    );

def diff = highVal-LowVal;

AddLabel(
    yes,
    AsDollars(RiskUnit) + " risk with " + AsDollars(diff) + " stop = " + Floor(Round(RiskUnit/diff)) + " shares",
    Color.Gray
    );
Last edited:
Gives 4 errors.I need some help in creating a label for the Swingarm zone that displays the distance from the trailing stop line to the Fib3 line and based on that display the position size to take based on the dollar risk set in the label parameters. I have found a similar label on the forum and think it can be used as reference / modification.
Edit: With my limited copy and paste knowledge I combined the two together.
Code:input RiskUnit = 100; input AggregationPeriod = AggregationPeriod.FIFTEEN_MIN; def highVal = Round(Fib3, 2); def lowVal = Round(TrailingStop, 2); AddLabel( yes, "High: " + highVal + " Low: " + lowVal, Color.Gray ); def diff = highVal-LowVal; AddLabel( yes, AsDollars(RiskUnit) + " risk with " + AsDollars(diff) + " stop = " + Floor(Round(RiskUnit/diff)) + " shares", Color.Gray );
@chewie76 where is Fib .618, a stronger support or resistance level, thanks!@unkownriver
This has shades, no bubbles.
Picture is SPY on 1 min. chart http://tos.mx/p31Urnx
The yellow line is 50% fib.

It's the next line color change from the yellow 50 line. Below it if in uptrend, and above it in downtrend.@chewie76 where is Fib .618, a stronger support or resistance level, thanks!
guyonabuffalo
New member
Hi Ben, can you create a strategy that opens a position when price crosses the fib3(88.6) level? I've done it with the close of the candle but I'd like it to trigger whenever price touches that 88.6 level.@madantv73 I don't recall seeing any backtesting strategy for this indicator. However, it should be fairly simple to set one up. How would you like the buy and sell orders to be triggered? I would keep the conditions within the SwingArm indicator's scope and not get any other scripts involved to simplify the coding process.
Could you share the code for close of the candle? I've been trying to create a strategy but no success.Hi Ben, can you create a strategy that opens a position when price crosses the fib3(88.6) level? I've done it with the close of the candle but I'd like it to trigger whenever price touches that 88.6 level.
I can I remove all of the bubbles and names@fjr1300 - thanks for your research and helping heart.
I am still a beginner trying to get success ..
https://tos.mx/lEkVYbC
Added all the studies those discussed in this group with latest code.
this is with white background. So edited a bit to change colors. Also shortened the comments in the bubbles.
I hope this is useful and let me know if you find anything wrong with this.
https://tos.mx/lEkVYbC
guyonabuffalo
New member
The addorder are at the bottom. As you can see I was playing around with different ways but I couldn't figure it out. Unfortunately I've moved onto a different strategy. Not because this one doesn't work, it really does, but I've found another that fits my style a bit better. If you do figure it out though, please post the results.Could you share the code for close of the candle? I've been trying to create a strategy but no success.
Code:
# Original Code From: TD Ameritrade IP Company, Inc. (c) 2009-2020
# Original StudyName: ATRTrailingStop
# Type: Study


# blackFLAG FTS SwingArms
# StudyName: blackFLAG_Futures_SwingArm_ATRTrail
# My preferred setting is 28 / 5 FOR ALL TIMEFRAMES
# Edited by: Jose Azcarate
# blackFLAG Futures Trading - FOR EDUCATIONAL PURPOSES ONLY
# TWITTER: @blackflagfuture
# UPDATED: 5/16/2020


# NOTE:  WHEN IMPORTING STUDY, MAKE SURE YOU UPDATE THE LOOK AND FEEL TO MATCH MY CHARTS WITHIN THE STUDY SETTINGS.


#-----------------------------------
#-----------------------------------
# BUY & SELL ALERTS ARE CREATED BY THE HULL MOVING AVERAGE TURNING POINTS STUDY AND MUST BE IN AGREEMENT WITH SWINGARM SUPPORT OR RESISTANCE ZONES TO BE VALID. (UseThinkScript.com by mashume - Upper Study).  MY UPDATED CODE INCLUDES THE BUY / SELL BUBBLES. THE SETTINGS ARE:  1 MIN: 255 PERIOD; 5 MIN: 255 PERIOD; 4 HOUR 255 PERIOD.
#-----------------------------------
#-----------------------------------


input trailType = {default modified, unmodified};
input ATRPeriod = 28;
input ATRFactor = 5;
input firstTrade = {default long, short};
input averageType = AverageType.WILDERS;


input fib1Level = 61.8;
input fib2Level = 78.6;
input fib3Level = 88.6;


Assert(ATRFactor > 0, "'atr factor' must be positive: " + ATRFactor);


def HiLo = Min(high - low, 1.5 * Average(high - low, ATRPeriod));
def HRef = if low <= high[1]
    then high - close[1]
    else (high - close[1]) - 0.5 * (low - high[1]);
def LRef = if high >= low[1]
    then close[1] - low
    else (close[1] - low) - 0.5 * (low[1] - high);


def trueRange;
switch (trailType) {
case modified:
    trueRange = Max(HiLo, Max(HRef, LRef));
case unmodified:
    trueRange = TrueRange(high, close, low);
}
def loss = ATRFactor * MovingAverage(averageType, trueRange, ATRPeriod);


def state = {default init, long, short};
def trail;
switch (state[1]) {
case init:
    if (!IsNaN(loss)) {
        switch (firstTrade) {
        case long:
            state = state.long;
            trail = close - loss;
        case short:
            state = state.short;
            trail = close + loss;
    }
    } else {
        state = state.init;
        trail = Double.NaN;
    }
case long:
    if (close > trail[1]) {
        state = state.long;
        trail = Max(trail[1], close - loss);
    } else {
        state = state.short;
        trail = close + loss;
    }
case short:
    if (close < trail[1]) {
        state = state.short;
        trail = Min(trail[1], close + loss);
    } else {
        state = state.long;
        trail = close - loss;
    }
}


def BuySignal = Crosses(state == state.long, 0, CrossingDirection.ABOVE);
def SellSignal = Crosses(state == state.short, 0, CrossingDirection.ABOVE);


def ex = if BuySignal then high else if SellSignal then low else if state == state.long then Max(ex[1], high) else if state == state.short then Min(ex[1], low) else ex[1];


plot TrailingStop = trail;


TrailingStop.SetPaintingStrategy(PaintingStrategy.POINTS);
TrailingStop.DefineColor("Long", Color.GREEN);
TrailingStop.DefineColor("Short", Color.RED);
TrailingStop.AssignValueColor(if state == state.long
    then TrailingStop.Color("Long")
    else TrailingStop.Color("Short"));


plot Extremum = ex;
Extremum.SetPaintingStrategy(PaintingStrategy.POINTS);
Extremum.DefineColor("HH", Color.GREEN);
Extremum.DefineColor("LL", Color.RED);
Extremum.AssignValueColor(if state == state.long
    then Extremum.Color("HH")
    else Extremum.Color("LL"));
Extremum.Hide();


def f1 = ex + (trail - ex) * fib1Level / 100;
def f2 = ex + (trail - ex) * fib2Level / 100;
def f3 = ex + (trail - ex) * fib3Level / 100;
def l100 = trail + 0;


plot Fib1 = f1;
Fib1.SetPaintingStrategy(PaintingStrategy.POINTS);
Fib1.SetDefaultColor(Color.BLACK);
Fib1.Hide();


plot Fib2 = f2;
Fib2.SetPaintingStrategy(PaintingStrategy.POINTS);
Fib2.SetDefaultColor(Color.BLACK);
Fib2.Hide();


plot Fib3 = f3;
Fib3.SetPaintingStrategy(PaintingStrategy.POINTS);
Fib3.SetDefaultColor(Color.BLACK);
Fib3.Hide();


AddCloud(f1, f2, Color.LIGHT_GREEN, Color.LIGHT_RED, no);
AddCloud(f2, f3, Color.GREEN, Color.RED, no);
AddCloud(f3, l100, Color.DARK_GREEN, Color.DARK_RED, no);


def l1 = state[1] == state.long and close crosses below f1[1];
def l2 = state[1] == state.long and close crosses below f2[1];
def l3 = state[1] == state.long and close crosses below f3[1];
def s1 = state[1] == state.short and close crosses above f1[1];
def s2 = state[1] == state.short and close crosses above f2[1];
def s3 = state[1] == state.short and close crosses above f3[1];


def atr = Average(TrueRange(high, close, low), 14);


plot LS1 = if l1 then low - atr else Double.NaN;
plot LS2 = if l2 then low - 1.5 * atr else Double.NaN;
plot LS3 = if l3 then low - 2 * atr else Double.NaN;
plot SS1 = if s1 then high + atr else Double.NaN;
plot SS2 = if s2 then high + 1.5 * atr else Double.NaN;
plot SS3 = if s3 then high + 2 * atr else Double.NaN;


LS1.SetPaintingStrategy(PaintingStrategy.ARROW_UP);
LS1.SetDefaultColor(Color.GREEN);
LS1.SetLineWeight(1);
LS1.Hide();
LS2.SetPaintingStrategy(PaintingStrategy.ARROW_UP);
LS2.SetDefaultColor(Color.GREEN);
LS2.SetLineWeight(1);
LS2.Hide();
LS3.SetPaintingStrategy(PaintingStrategy.ARROW_UP);
LS3.SetDefaultColor(Color.GREEN);
LS3.SetLineWeight(1);
LS3.Hide();


SS1.SetPaintingStrategy(PaintingStrategy.ARROW_DOWN);
SS1.SetDefaultColor(Color.RED);
SS1.SetLineWeight(1);
SS1.Hide();
SS2.SetPaintingStrategy(PaintingStrategy.ARROW_DOWN);
SS2.SetDefaultColor(Color.RED);
SS2.SetLineWeight(1);
SS2.Hide();
SS3.SetPaintingStrategy(PaintingStrategy.ARROW_DOWN);
SS3.SetDefaultColor(Color.RED);
SS3.SetLineWeight(1);
SS3.Hide();


Alert(l1, "Price crossed below Fib1 level in long trend", Alert.BAR, Sound.Bell);
#Alert(l2, "Price crossed below Fib2 level in long trend", Alert.BAR, Sound.Bell);
#Alert(l3, "Price crossed below Fib3 level in long trend", Alert.BAR, Sound.Bell);
Alert(s1, "Price crossed above Fib1 level in short trend", Alert.BAR, Sound.Bell);
#Alert(s2, "Price crossed above Fib2 level in short trend", Alert.BAR, Sound.Bell);
#Alert(s3, "Price crossed above Fib3 level in short trend", Alert.BAR, Sound.Bell);


#AddOrder(OrderType.BUY_TO_OPEN, condition = l3, price = open, 1, tickColor = GetColor(1), arrowColor = GetColor(1), name #= "BTO");
AddOrder(OrderType.BUY_TO_OPEN, condition = l3, close[0], 1, tickColor = GetColor(1), arrowColor = GetColor(1), name = "BTO");
#AddOrder(OrderType.BUY_TO_OPEN, price crosses below f3, tickcolor = GetColor(1), arrowcolor = GetColor(1), name = "BTO");
#AddOrder(OrderType.SELL_TO_CLOSE, close > EntryPrice() - 40);
#AddOrder(OrderType.SELL_TO_OPEN, condition = s3, price = open, 1, tickColor = GetColor(2), arrowColor = GetColor(2), name #= "STO");
#AddOrder(OrderType.SELL_TO_OPEN, condition = s3, 1, tickColor = GetColor(2), arrowColor = GetColor(2), name = "STO");⚠ This thread has exhausted its substantive discussion of this indicator so it has been locked ⚠
This thread is still available for reading. If looking for specific information in this thread, here is a great hack for searching many-paged threads.so is there a way to set up a scan that can alert you when the price hits the 61.8 fib level?Created by RyanHendricks.

thinkScript Code
Rich (BB code):#hint Price: Price used in the alerts on crossing retracement lines. <b>(Default is Close)</b> #hint onExpansion: Determines if the retracement lines are projected past the current bar into the right side expansion <b>(Default is Yes)</b> #hint Extend_to_left: Determines if the retracement lines are extended to the left side of the chart. <b>(Default is No)</b> #hint Coefficient0: Retracement Line 0: Retracement from the highest high to the lowest low.<b>(Default is 0%)</b> #hint Coefficient_1: Retracement Line 1: Retracement from the highest high to the lowest low.<b>(Default is 23.6%)</b> #hint Coefficient_2: Retracement Line 2: Retracement from the highest high to the lowest low.<b>(Default is 38.2%)</b> #hint Coefficient_3: Retracement Line 3: Retracement from the highest high to the lowest low.<b>(Default is 50%)</b> #hint Coefficient_4: Retracement Line 4: Retracement from the highest high to the lowest low.<b>(Default is 61.8%)</b> #hint Coefficient_5: Retracement Line 5: Retracement from the highest high to the lowest low.<b>(Default is 78.6%)</b> #hint Coefficient_6: Retracement Line 6: Retracement from the highest high to the lowest low.<b>(Default is 100%)</b> #wizard input: Price #wizard text: Inputs: Price: #wizard input: onExpansion #wizard text: onExpansion: #wizard input: Extend_to_left #wizard text: Extend_to_left: #wizard input: Coefficient0 #wizard text: Coefficient0: #wizard input: Coefficient_1 #wizard text: Coefficient_1: #wizard input: Coefficient_2 #wizard text: Coefficient_2: #wizard input: Coefficient_3 #wizard text: Coefficient_3: #wizard input: Coefficient_4 #wizard text: Coefficient_4: #wizard input: Coefficient_5 #wizard text: Coefficient_5: #wizard input: Coefficient_6 #wizard text: Coefficient_6: input price = close; input high = high; input low = low; input onExpansion = Yes; input Extend_to_left = no; input Coefficient0 = 0.000; input coefficient_1 = .236; input Coefficient_2 = .382; input Coefficient_3 = .500; input Coefficient_4 = .618; Input Coefficient_5 = .786; input Coefficient_6 = 1.000; def a = HighestAll(high); def b = LowestAll(low); def barnumber = barNumber(); def c = if high == a then barnumber else double.nan; def d = if low == b then barnumber else double.nan; rec highnumber = compoundValue(1, if IsNaN(c) then highnumber[1] else c, c); def highnumberall = HighestAll(highnumber); rec lownumber = compoundValue(1, if IsNaN(d) then lownumber[1] else d, d); def lownumberall = LowestAll(lownumber); def upward = highnumberall > lownumberall; def downward = highnumberall < lownumberall; def x = AbsValue(lownumberall - highnumberall ); def slope = (a - b) / x; def slopelow = (b - a) / x; def day = getDay(); def month = getMonth(); def year = getYear(); def lastDay = getLastDay(); def lastmonth = getLastMonth(); def lastyear = getLastYear(); def isToday = if(day == lastDay and month == lastmonth and year == lastyear, 1, 0); def istodaybarnumber = HighestAll(if isToday then barnumber else double.nan); def line = b + (slope * (barnumber - lownumber)); def linelow = a + (slopelow * (barnumber - highnumber)); def currentlinelow = if barnumber <= lownumberall then linelow else double.nan; def currentline = if barnumber <= highnumberall then line else double.nan; Plot FibFan = if downward then currentlinelow else if upward then currentline else double.nan; FibFan.SetStyle(Curve.SHORT_DASH); FibFan.AssignValueColor(color.red); fibfan.hidebubble(); def range = a - b; Plot Retracement0 = if downward and !onexpansion and !extend_to_left and barnumber >= highnumberall and barnumber <= istodaybarnumber then highestall((b + (range * coefficient0))) else if upward and !extend_to_left and !onexpansion and barnumber >= lownumberall and barnumber <= istodaybarnumber then highestall(a - (range * coefficient0)) else if downward and onexpansion and !extend_to_left and barnumber >= highnumberall then highestall((b + (range * coefficient0))) else if upward and onexpansion and barnumber >= lownumberall and !extend_to_left then highestall(a - (range * coefficient0)) else if downward and !onexpansion and extend_to_left and barnumber <= istodaybarnumber then highestall((b + (range * coefficient0))) else if upward and extend_to_left and !onexpansion and barnumber <= istodaybarnumber then highestall(a - (range * coefficient0)) else if downward and onexpansion and extend_to_left then highestall((b + (range * coefficient0))) else if upward and onexpansion and extend_to_left then highestall(a - (range * coefficient0)) else double.nan; Retracement0.assignvaluecolor(color.red); retracement0.hidebubble(); #AddChartBubble((barnumber == istodaybarnumber +10), retracement0, concat( "$", round(retracement0, 2)), color.red, yes); AddChartBubble((downward and barnumber == highnumberall), retracement0, concat( (coefficient0 * 100), "%"), color.red, yes); AddChartBubble((upward and barnumber == lownumberall), retracement0, concat( (coefficient0 * 100), "%"), color.red, yes); Plot Retracement1 = if downward and !onexpansion and !extend_to_left and barnumber >= highnumberall and barnumber <= istodaybarnumber then highestall((b + (range * coefficient_1))) else if upward and !extend_to_left and !onexpansion and barnumber >= lownumberall and barnumber <= istodaybarnumber then highestall(a - (range * coefficient_1)) else if downward and onexpansion and !extend_to_left and barnumber >= highnumberall then highestall((b + (range * coefficient_1))) else if upward and onexpansion and barnumber >= lownumberall and !extend_to_left then highestall(a - (range * coefficient_1)) else if downward and !onexpansion and extend_to_left and barnumber <= istodaybarnumber then highestall((b + (range * coefficient_1))) else if upward and extend_to_left and !onexpansion and barnumber <= istodaybarnumber then highestall(a - (range * coefficient_1)) else if downward and onexpansion and extend_to_left then highestall((b + (range * coefficient_1))) else if upward and onexpansion and extend_to_left then highestall(a - (range * coefficient_1)) else double.nan; Retracement1.assignvaluecolor(color.red); retracement1.hidebubble(); #AddChartBubble((barnumber == istodaybarnumber+10), retracement1, concat( "$", round(retracement1, 2)), color.red, yes); AddChartBubble((downward and barnumber == highnumberall), retracement1, concat( (coefficient_1 * 100), "%"), color.red, yes); AddChartBubble((upward and barnumber == lownumberall), retracement1, concat( (coefficient_1 * 100), "%"), color.red, yes); Plot Retracement2 =if downward and !onexpansion and !extend_to_left and barnumber >= highnumberall and barnumber <= istodaybarnumber then highestall((b + (range * coefficient_2))) else if upward and !extend_to_left and !onexpansion and barnumber >= lownumberall and barnumber <= istodaybarnumber then highestall(a - (range * coefficient_2)) else if downward and onexpansion and !extend_to_left and barnumber >= highnumberall then highestall((b + (range * coefficient_2))) else if upward and onexpansion and barnumber >= lownumberall and !extend_to_left then highestall(a - (range * coefficient_2)) else if downward and !onexpansion and extend_to_left and barnumber <= istodaybarnumber then highestall((b + (range * coefficient_2))) else if upward and extend_to_left and !onexpansion and barnumber <= istodaybarnumber then highestall(a - (range * coefficient_2)) else if downward and onexpansion and extend_to_left then highestall((b + (range * coefficient_2))) else if upward and onexpansion and extend_to_left then highestall(a - (range * coefficient_2)) else double.nan; Retracement2.assignvaluecolor(color.red); retracement2.hidebubble(); #AddChartBubble((barnumber == istodaybarnumber+10), retracement2, concat( "$", round(retracement2, 2)), color.red, yes); AddChartBubble((downward and barnumber == highnumberall), retracement2, concat( (coefficient_2 * 100), "%"), color.red, yes); AddChartBubble((upward and barnumber == lownumberall), retracement2, concat( (coefficient_2 * 100), "%"), color.red, yes); Plot Retracement3 = if downward and !onexpansion and !extend_to_left and barnumber >= highnumberall and barnumber <= istodaybarnumber then highestall((b + (range * coefficient_3))) else if upward and !extend_to_left and !onexpansion and barnumber >= lownumberall and barnumber <= istodaybarnumber then highestall(a - (range * coefficient_3)) else if downward and onexpansion and !extend_to_left and barnumber >= highnumberall then highestall((b + (range * coefficient_3))) else if upward and onexpansion and barnumber >= lownumberall and !extend_to_left then highestall(a - (range * coefficient_3)) else if downward and !onexpansion and extend_to_left and barnumber <= istodaybarnumber then highestall((b + (range * coefficient_3))) else if upward and extend_to_left and !onexpansion and barnumber <= istodaybarnumber then highestall(a - (range * coefficient_3)) else if downward and onexpansion and extend_to_left then highestall((b + (range * coefficient_3))) else if upward and onexpansion and extend_to_left then highestall(a - (range * coefficient_3)) else double.nan; Retracement3.assignvaluecolor(color.red); retracement3.hidebubble(); #AddChartBubble((barnumber == istodaybarnumber+10), retracement3, concat( "$", round(retracement3, 2)), color.red, yes); AddChartBubble((upward and barnumber == lownumberall), retracement3, concat( (coefficient_3 * 100), "%"), color.red, yes); AddChartBubble((downward and barnumber == highnumberall), retracement3, concat( (coefficient_3 * 100), "%"), color.red, yes); AddChartBubble((upward and barnumber == lownumberall), retracement3, concat( (coefficient_3 * 100), "%"), color.red, yes); Plot Retracement4 = if downward and !onexpansion and !extend_to_left and barnumber >= highnumberall and barnumber <= istodaybarnumber then highestall((b + (range * coefficient_4))) else if upward and !extend_to_left and !onexpansion and barnumber >= lownumberall and barnumber <= istodaybarnumber then highestall(a - (range * coefficient_4)) else if downward and onexpansion and !extend_to_left and barnumber >= highnumberall then highestall((b + (range * coefficient_4))) else if upward and onexpansion and barnumber >= lownumberall and !extend_to_left then highestall(a - (range * coefficient_4)) else if downward and !onexpansion and extend_to_left and barnumber <= istodaybarnumber then highestall((b + (range * coefficient_4))) else if upward and extend_to_left and !onexpansion and barnumber <= istodaybarnumber then highestall(a - (range * coefficient_4)) else if downward and onexpansion and extend_to_left then highestall((b + (range * coefficient_4))) else if upward and onexpansion and extend_to_left then highestall(a - (range * coefficient_4)) else double.nan; Retracement4.assignvaluecolor(color.red); retracement4.hidebubble(); #AddChartBubble((barnumber == istodaybarnumber+10), retracement4, concat( "$", round(retracement4, 2)), color.red, yes); AddChartBubble((downward and barnumber == highnumberall), retracement4, concat( (coefficient_4 * 100), "%"), color.red, yes); AddChartBubble((upward and barnumber == lownumberall), retracement4, concat( (coefficient_4 * 100), "%"), color.red, yes); Plot Retracement5 = if downward and !onexpansion and !extend_to_left and barnumber >= highnumberall and barnumber <= istodaybarnumber then highestall((b + (range * coefficient_5))) else if upward and !extend_to_left and !onexpansion and barnumber >= lownumberall and barnumber <= istodaybarnumber then highestall(a - (range * coefficient_5)) else if downward and onexpansion and !extend_to_left and barnumber >= highnumberall then highestall((b + (range * coefficient_5))) else if upward and onexpansion and barnumber >= lownumberall and !extend_to_left then highestall(a - (range * coefficient_5)) else if downward and !onexpansion and extend_to_left and barnumber <= istodaybarnumber then highestall((b + (range * coefficient_5))) else if upward and extend_to_left and !onexpansion and barnumber <= istodaybarnumber then highestall(a - (range * coefficient_5)) else if downward and onexpansion and extend_to_left then highestall((b + (range * coefficient_5))) else if upward and onexpansion and extend_to_left then highestall(a - (range * coefficient_5)) else double.nan; Retracement5.assignvaluecolor(color.red); retracement5.hidebubble(); #AddChartBubble((barnumber == istodaybarnumber+10), retracement5, concat( "$", round(retracement5, 2)), color.red, yes); AddChartBubble((downward and barnumber == highnumberall), retracement5, concat( (coefficient_5 * 100), "%"), color.red, yes); AddChartBubble((upward and barnumber == lownumberall), retracement5, concat( (coefficient_5 * 100), "%"), color.red, yes); Plot Retracement6 = if downward and !onexpansion and !extend_to_left and barnumber >= highnumberall and barnumber <= istodaybarnumber then highestall((b + (range * coefficient_6))) else if upward and !extend_to_left and !onexpansion and barnumber >= lownumberall and barnumber <= istodaybarnumber then highestall(a - (range * coefficient_6)) else if downward and onexpansion and !extend_to_left and barnumber >= highnumberall then highestall((b + (range * coefficient_6))) else if upward and onexpansion and barnumber >= lownumberall and !extend_to_left then highestall(a - (range * coefficient_6)) else if downward and !onexpansion and extend_to_left and barnumber <= istodaybarnumber then highestall((b + (range * coefficient_6))) else if upward and extend_to_left and !onexpansion and barnumber <= istodaybarnumber then highestall(a - (range * coefficient_6)) else if downward and onexpansion and extend_to_left then highestall((b + (range * coefficient_6))) else if upward and onexpansion and extend_to_left then highestall(a - (range * coefficient_6)) else double.nan; Retracement6.assignvaluecolor(color.red); retracement6.hidebubble(); #AddChartBubble((barnumber == istodaybarnumber+10), retracement6, concat( "$", round(retracement6, 2)), color.red, yes); AddChartBubble((downward and barnumber == highnumberall), retracement6, concat( (coefficient_6 * 100), "%"), color.red, yes); AddChartBubble((upward and barnumber == lownumberall), retracement6, concat( (coefficient_6 * 100), "%"), color.red, yes); alert((price crosses below Retracement0) , "Price crosses below Retracement Line 0"); alert((price crosses above Retracement0) , "Price crosses above Retracement Line 0"); alert((price crosses below Retracement1) , "Price crosses below Retracement Line 1"); alert((price crosses above Retracement1) , "Price crosses above Retracement Line 1"); alert((price crosses below Retracement2) , "Price crosses below Retracement Line 2"); alert((price crosses above Retracement2) , "Price crosses above Retracement Line 2"); alert((price crosses below Retracement3) , "Price crosses below Retracement Line 3"); alert((price crosses above Retracement3) , "Price crosses above Retracement Line 3"); alert((price crosses below Retracement4) , "Price crosses below Retracement Line 4"); alert((price crosses above Retracement4) , "Price crosses above Retracement Line 4"); alert((price crosses below Retracement5) , "Price crosses below Retracement Line 5"); alert((price crosses above Retracement5) , "Price crosses above Retracement Line 5"); alert((price crosses below Retracement6) , "Price crosses below Retracement Line 6"); alert((price crosses above Retracement6) , "Price crosses above Retracement Line 6");
Shareable Link
https://tos.mx/Fz8Ss0
I have the swingARM scanner (https://usethinkscript.com/threads/...railing-stop-and-fibonacci-retracements.2486/)
and also the bull and bear scan (https://usethinkscript.com/threads/...op-and-fibonacci-retracements.2486/post-29434)
but want to know if there is a way to have a single scan for fib level 1 (which is 61.8) . so when the price hits that value, it can pop up the ticker in my scanning watchlist. likewise I think I can make that scanner in to bullish or bearish scanner with slight modifications or conditions.
but cant figure out how to get a trigger alert for stock on 30 mins chart or 1 hr to alert when price hits it.
i don't have a problem setting up a watchlist scan. the issue is specific scan coding in TOS.
I use the swing arm fib levels with trailing ATR. and want to get help in setting up a scan that can show stocks on a given time period when price hits the 61.8 fib level.....
https://ibb.co/g6SwcdP
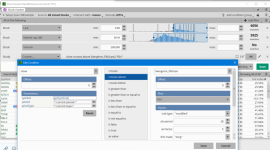
here is a screenshot.... with possible alert areas when the price hits the yellow 61.8 fib level
I use the swing arm fib levels with trailing ATR. and want to get help in setting up a scan that can show stocks on a given time period when price hits the 61.8 fib level.....
https://ibb.co/g6SwcdP
here is a screenshot.... with possible alert areas when the price hits the yellow 61.8 fib level
To use this scan, first add this script to your study tab:
https://usethinkscript.com/threads/...p-and-fibonacci-retracements.2486/#post-23244
You want a scan of where close crosses above the SwingArm's fib1 (61.8)

https://usethinkscript.com/threads/...p-and-fibonacci-retracements.2486/#post-23244
You want a scan of where close crosses above the SwingArm's fib1 (61.8)
- In the scanner choose price and then close in the left column
- crosses above in the middle column
- choose the name of your SwingArm's study in the right column and then under plot choose fib1
Attachments
Last edited:
stocksniper
Member
Is there a SwingArm Scan that can scan for stocks that are trading above certain time frames. For example I want to scan for stocks that are trading above the Daily, 4HR, 1Hr SwingArms? Thanks in advance.
@stocksniper Sure! Set up your scan filter 3x times and change the aggregation to Daily, 4hr, and 1hr
Swing Arm Scan instructions:
https://usethinkscript.com/threads/...ibonacci-retracements.2486/page-37#post-41358
Swing Arm Scan instructions:
https://usethinkscript.com/threads/...ibonacci-retracements.2486/page-37#post-41358
pchandu201
New member
can some point me to swingarm_fib scans page
@pchandu201 Sure! Look at the post above yours
- Status
- Not open for further replies.
Join useThinkScript to post your question to a community of 21,000+ developers and traders.
Not the exact question you're looking for?
Start a new thread and receive assistance from our community.
87k+
Posts
2049
Online
The Market Trading Game Changer
Join 2,500+ subscribers inside the useThinkScript VIP Membership Club
- Exclusive indicators
- Proven strategies & setups
- Private Discord community
- ‘Buy The Dip’ signal alerts
- Exclusive members-only content
- Add-ons and resources
- 1 full year of unlimited support
Frequently Asked Questions
What is useThinkScript?
useThinkScript is the #1 community of stock market investors using indicators and other tools to power their trading strategies. Traders of all skill levels use our forums to learn about scripting and indicators, help each other, and discover new ways to gain an edge in the markets.
How do I get started?
We get it. Our forum can be intimidating, if not overwhelming. With thousands of topics, tens of thousands of posts, our community has created an incredibly deep knowledge base for stock traders. No one can ever exhaust every resource provided on our site.
If you are new, or just looking for guidance, here are some helpful links to get you started.
- The most viewed thread:
https://usethinkscript.com/threads/repainting-trend-reversal-for-thinkorswim.183/ - Our most popular indicator:
https://usethinkscript.com/threads/buy-the-dip-indicator-for-thinkorswim.3553/ - Answers to frequently asked questions:
https://usethinkscript.com/threads/answers-to-commonly-asked-questions.6006/
What are the benefits of VIP Membership?
VIP members get exclusive access to these proven and tested premium indicators: Buy the Dip, Advanced Market Moves 2.0, Take Profit, and Volatility Trading Range. In addition, VIP members get access to over 50 VIP-only custom indicators, add-ons, and strategies, private VIP-only forums, private Discord channel to discuss trades and strategies in real-time, customer support, trade alerts, and much more. Learn all about VIP membership here.
How can I access the premium indicators?
To access the premium indicators, which are plug and play ready, sign up for VIP membership here.